 Adolanium
Hermes Data
An agentic report page for Hermes Desktop. Open a spreadsheet and Hermes finds the story in it, chart by chart. You decide what goes on the page.
What it does
- Bring a table. Open an Excel workbook, a CSV or a JSON file, paste rows from a spreadsheet, or drag a CSV onto the page. Data works out which columns are numbers, dates and categories.
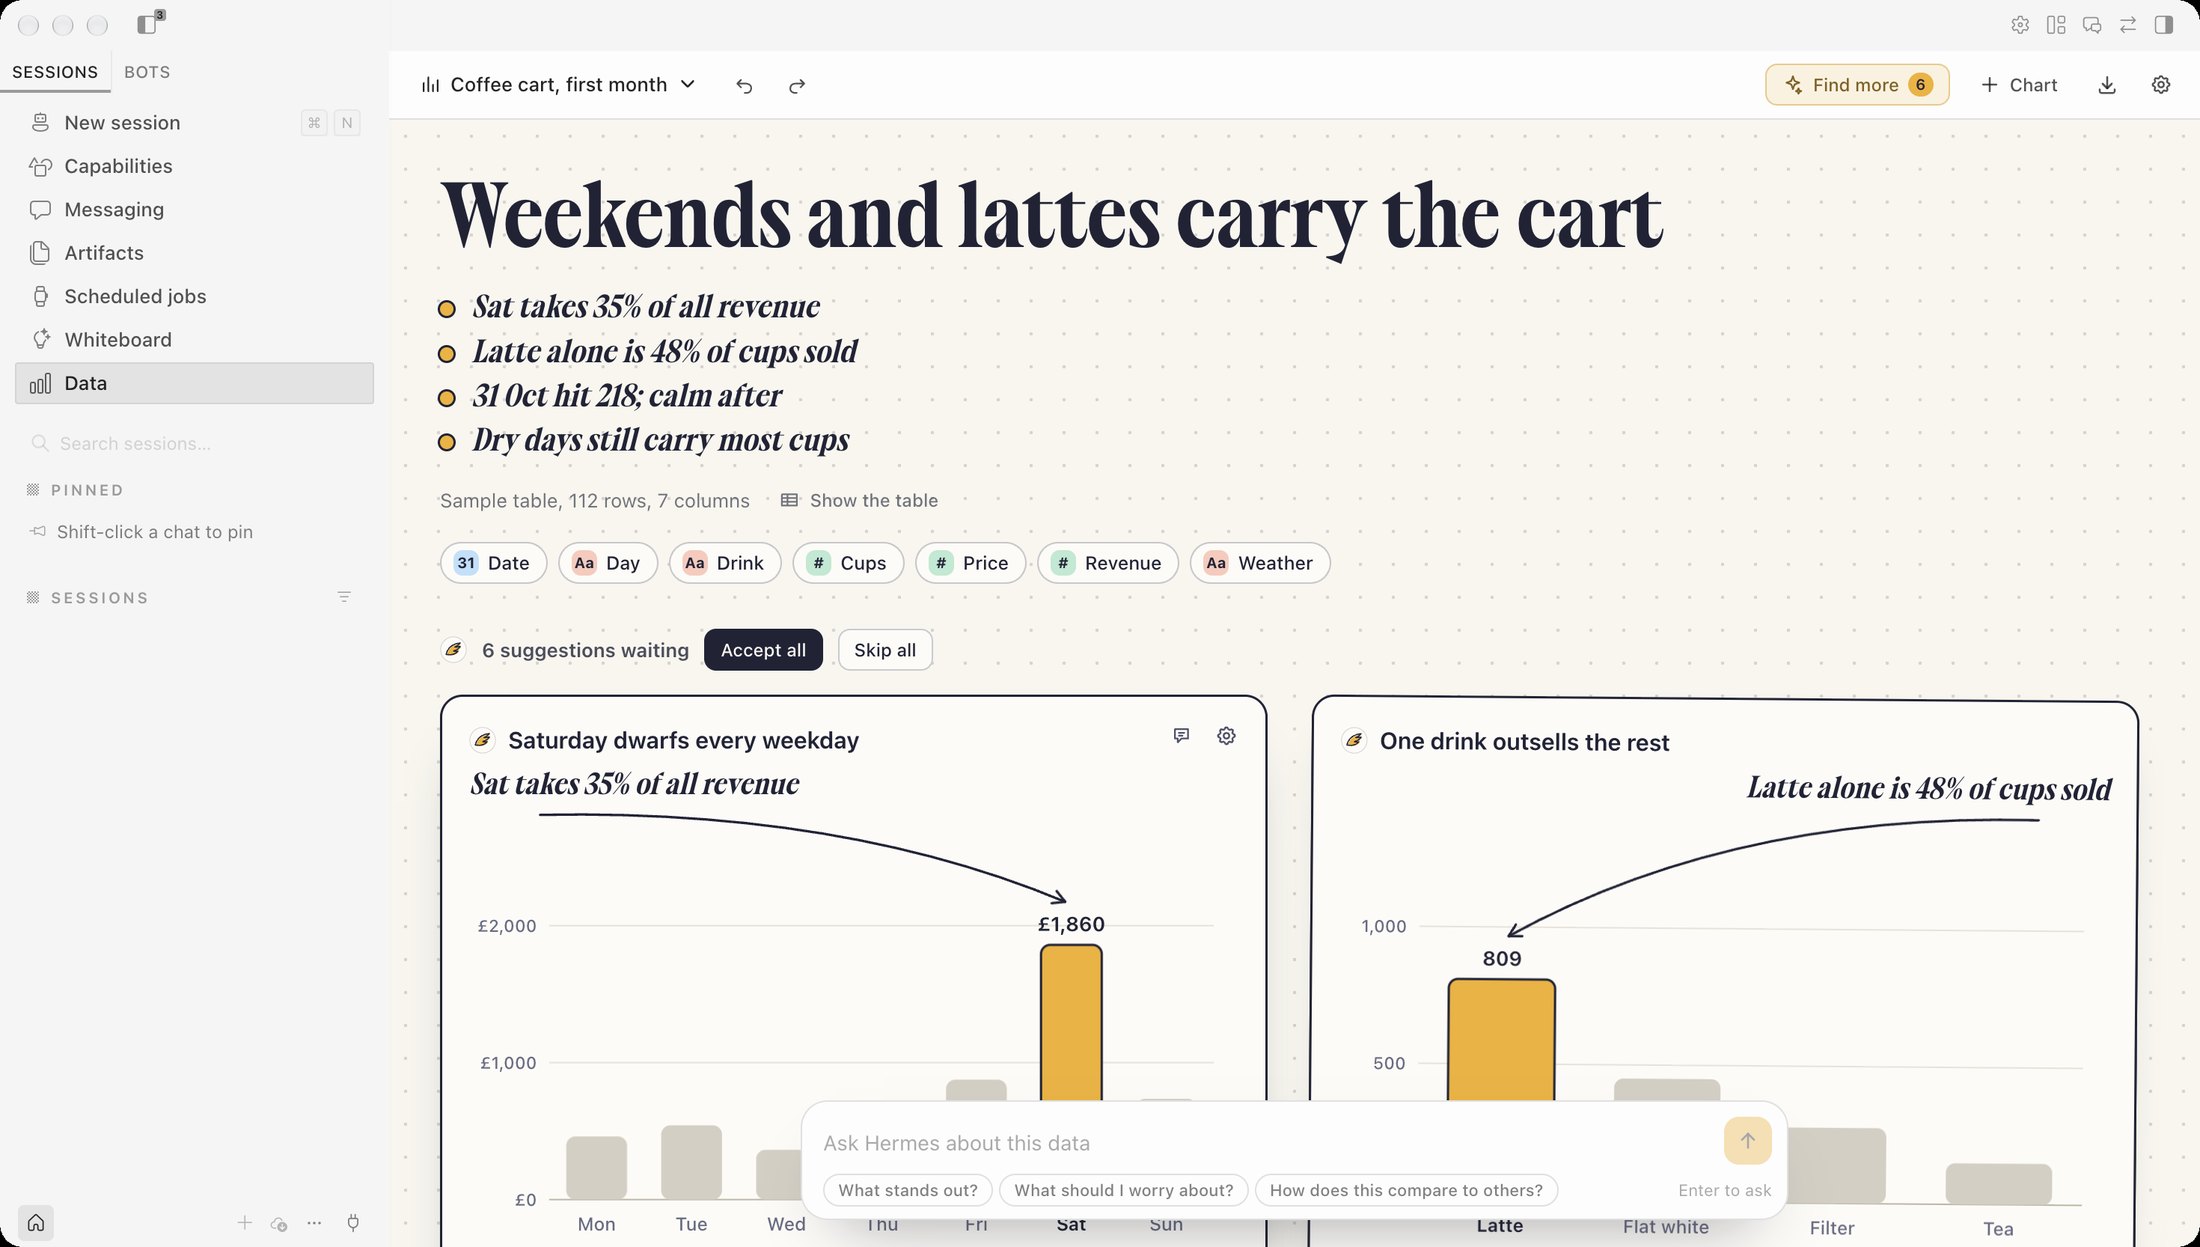
- Find the story. Hermes reads the columns and a few real cuts of the numbers, then suggests a headline and three to five charts. Each chart makes one point, with a short remark and an arrow to the mark it is about.
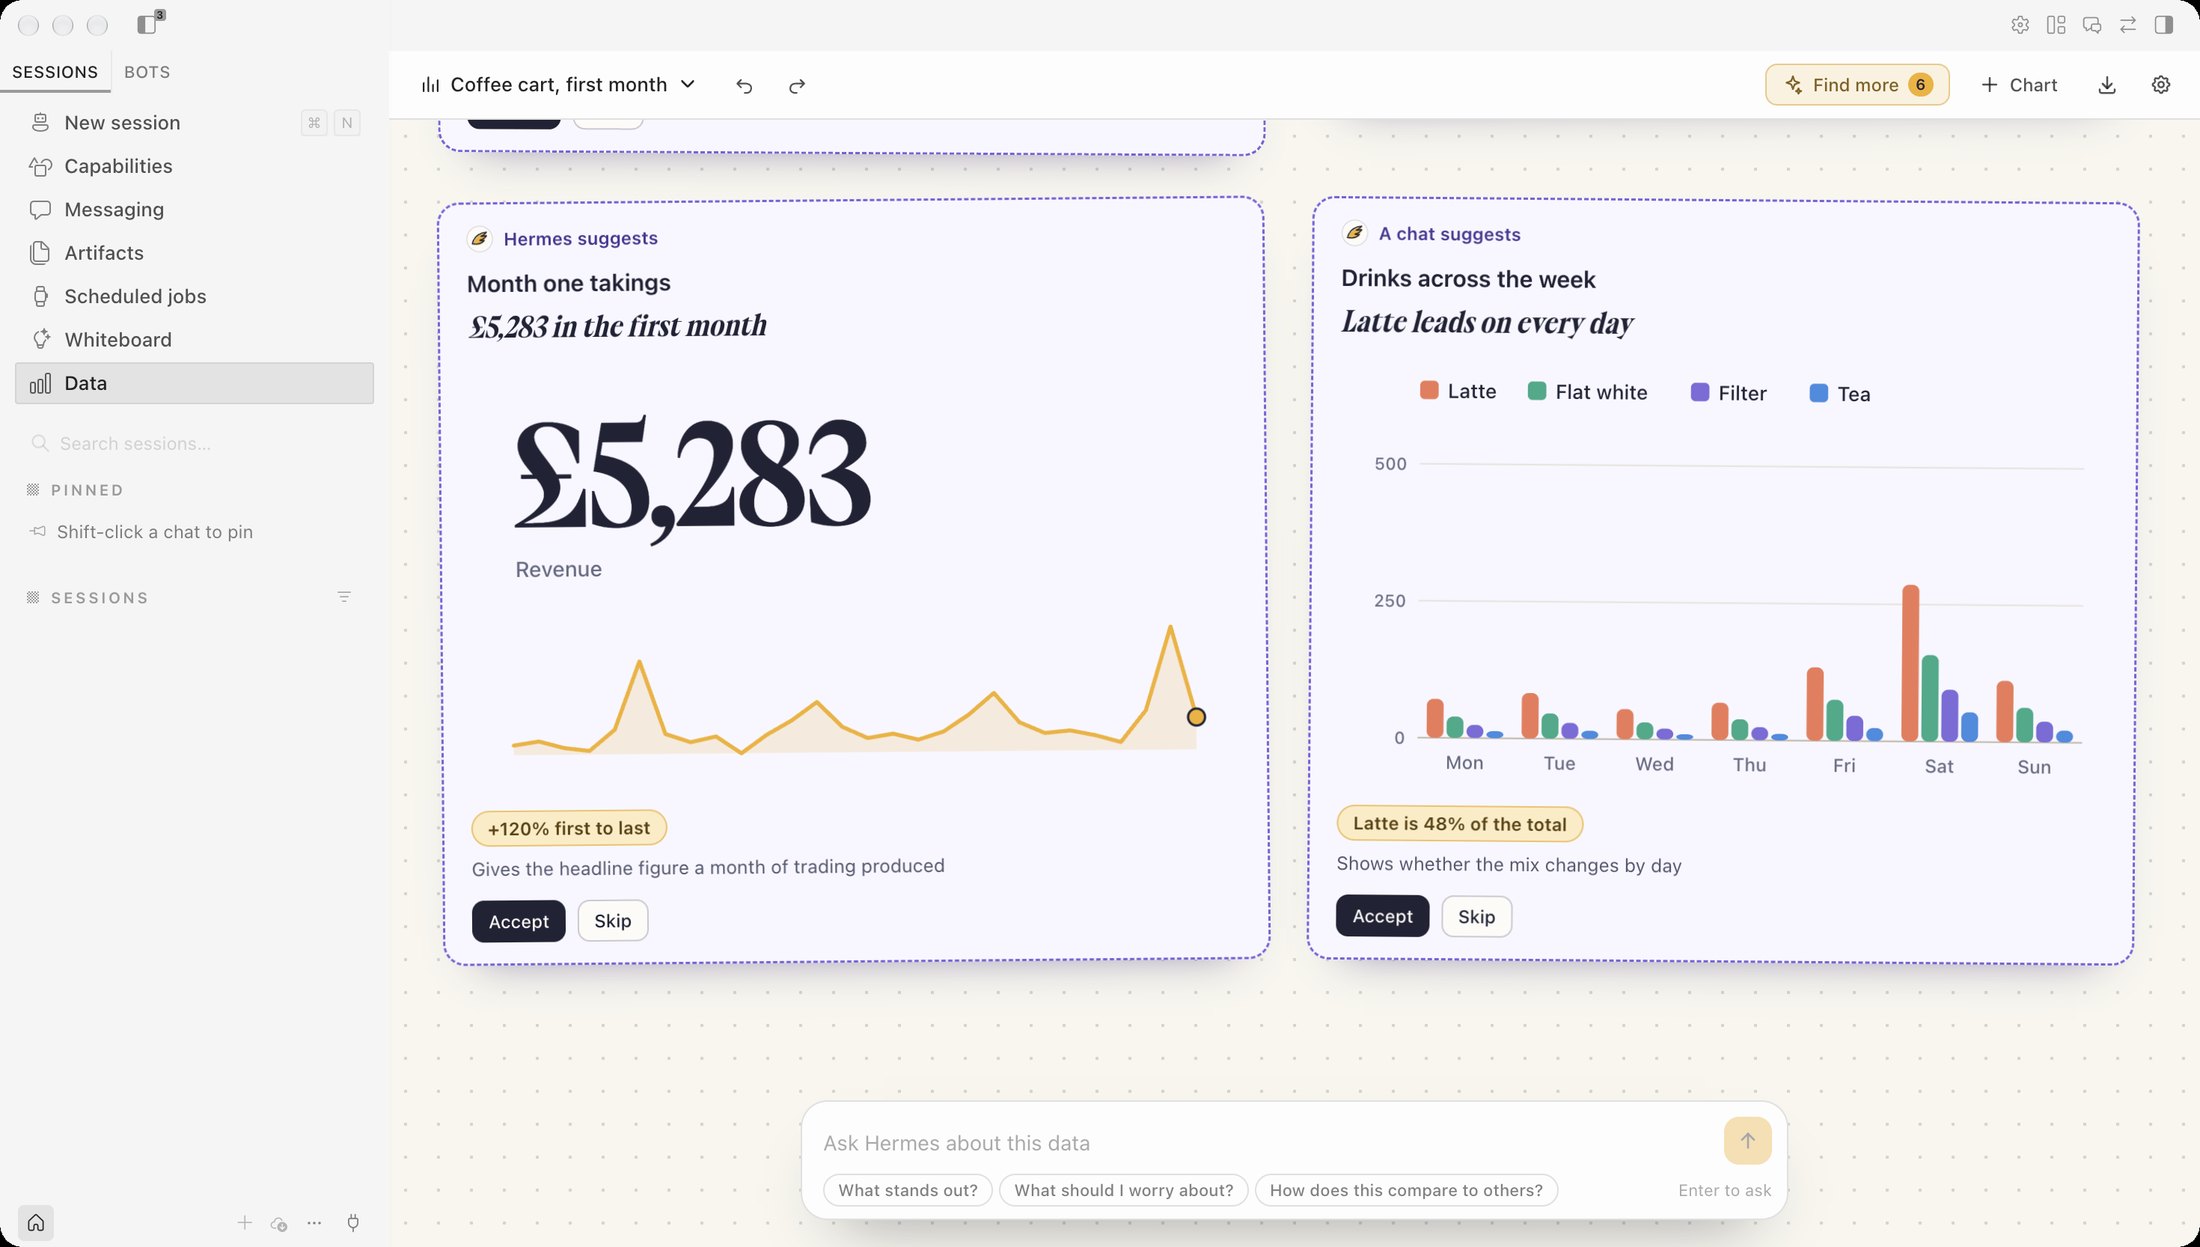
- You decide. Suggestions wait beside the page with a dashed outline. Accept the ones you want, skip the rest, and undo any of it.
- Every number is computed, not written. Hermes picks the columns and the wording. The page adds up your rows itself. A remark can only quote a figure through a placeholder the page fills in, and a remark with a figure typed by the model is dropped.
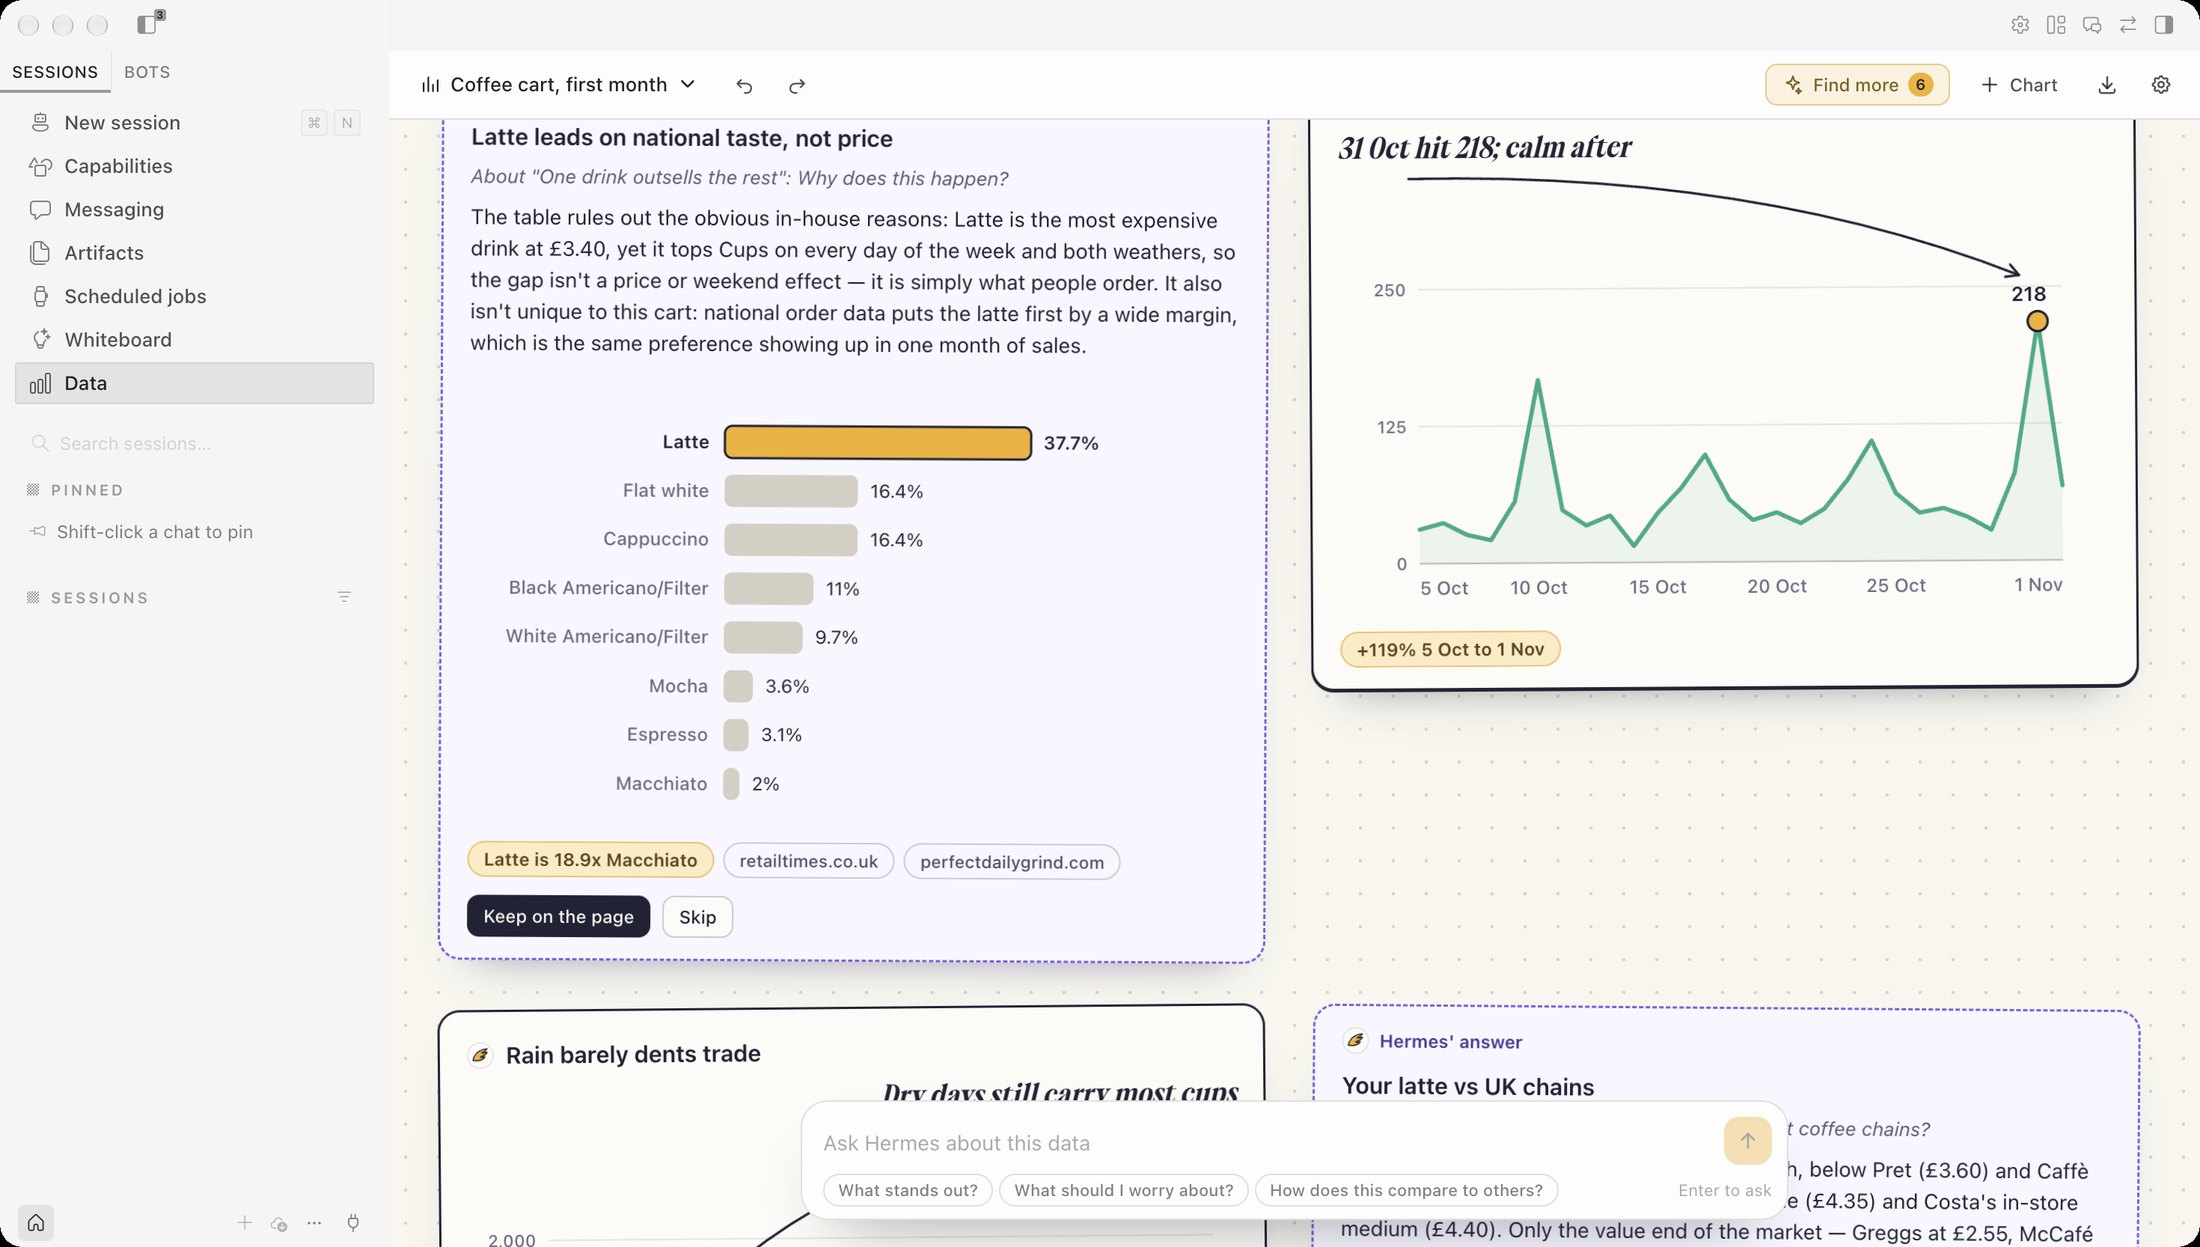
- Ask a question. Hermes answers with a chart. If the table cannot answer it, an agent searches the web and comes back with a small table and the pages it read.
- Ask about one chart. Press the speech bubble on a chart and ask why it looks the way it does. Hermes gets that chart's real numbers, and the answer lands right beside it.
- Make it yours. Click a bar or a point to move the highlight, and the arrow and the words beside it follow. Redraw a chart as bars, a line, an area, a donut, dots or one big number. Split it by a second column into one coloured series per value. Make it full width, reorder it, rename it, or build your own.
- Key points. The report opens with a short list of what its charts say. Each line is a chart's remark or its computed fact, so the summary cannot claim something a chart does not show.
- Share it. Export the report as a single web page or Markdown, a chart as SVG, or the table as CSV.
- From any chat. Once you allow it, a Hermes chat can read your reports, propose charts for one, or open a new report from data it gathered.
Install
hermes plugins install Adolanium/hermes-data
Then switch on Data in Capabilities › Plugins and open it from the sidebar. It needs Hermes 0.22.6 or newer.
No file to hand? Press Try a sample for four weeks of a coffee cart.
What it reads
- Excel
.xlsxworkbooks up to 8 MB. A workbook with several sheets asks which one. Dates, currency and percentage formats are kept. A formula cell gives the value Excel last saved for it. Old.xlsfiles need saving as.xlsxfirst. - CSV,
.tsvand.txttables up to 4 MB, with a header row. Commas, tabs, semicolons and pipes are detected. - JSON as a list of records, a list of rows, or an object holding one such list.
- Pasted rows from any spreadsheet.
- Numbers with thousands separators, a currency sign, a percent sign or accountant's brackets.
- Dates as
2026-10-05,05/10/2026,5 Oct 2026,October 5, 2026orOct 2026. Day-first and month-first are told apart when the column makes it clear. - The first 5,000 rows and 40 columns. A longer table is cut there and the page says so.
Workbooks are read by the plugin's backend with Python's standard library only. No spreadsheet package is installed, no macros run and no formulas are evaluated.
AI, when you ask
Nothing runs until you click.
- Find the story and Find more each start one hidden Hermes session on your own model. It is told to use no tools. It sees the column names and types, summary numbers, up to twelve grouped totals the page worked out, and the first eight rows. It never gets the whole table.
- Ask, about the table or about one chart, starts a hidden Hermes session that may use your Hermes tools, mainly web search and page reading. A question about a chart also sends that chart's points. It is told not to send messages, write files, run commands or schedule anything. If it uses such a tool anyway, the answer says which.
- Approval prompts inside these sessions are denied automatically, because nobody could see them.
- Budgets. Reading a table stops after 150 seconds. An answer stops after 4 minutes or 24 tool calls. Every run has a Stop button.
- Answer text is written by the model. The chart under it is drawn by the page, but the sentences are Hermes' own, so check them against the chart.
- Hermes gives plugins no way to delete sessions, so these stay hidden in your session store.
Model calls apply your provider's normal usage costs.
Privacy
Your file  →  this page's storage  →  your Hermes model (a summary and eight rows, only when you ask)
                                   ↘  a copy in Hermes plugin data (only after you let chats read your reports)
                                   ↘  the web, through your Hermes web tools (only when an answer needs it)
- Reports and their tables live in Hermes plugin storage on this desktop.
- Chats can read my reports is off until you turn it on in Settings. While it is on, Data keeps a copy of each report under
plugin-data/data/in your Hermes home: the columns, the charts and the first 400 rows. Turning it off deletes the copies. - Open and export go through the system dialog. The page opens it with the Desktop SDK and hands the path to Data's own backend, which reads
.xlsx,.csv,.tsv,.txtand.json, writes.html,.md,.svgand.csv, and refuses anything inside your Hermes home. - A CSV or JSON file you drag onto the page is read by the page itself and never leaves it. A dragged workbook opens the file dialog instead, because only the backend reads workbooks.
- No telemetry, no credentials, no shell commands or background processes of its own. The page makes no network requests of its own.
Limits
- One table per report. There are no joins across tables.
- Charts are bars, lines, areas, donuts, dots and single numbers. A split shows at most five series, with the rest added together as "Other". There are no maps, heatmaps or stacked bars.
- Scatter charts draw at most 600 points, sampled evenly from the table.
- Chats see reports only while Hermes Desktop is running with Data switched on.
- A report holds up to 40 charts.
Development checks
node check.mjs
node --test tests/data.test.mjs
python -m pytest tests/test_tools.py
desktop/plugin.js is one hand-written file with no build step and no bundled libraries. Charts are plain SVG drawn in that file.
License
MIT
README from the reviewed commit b7706c8; it updates when the author re-pins.