rohitdanda
Mission Control
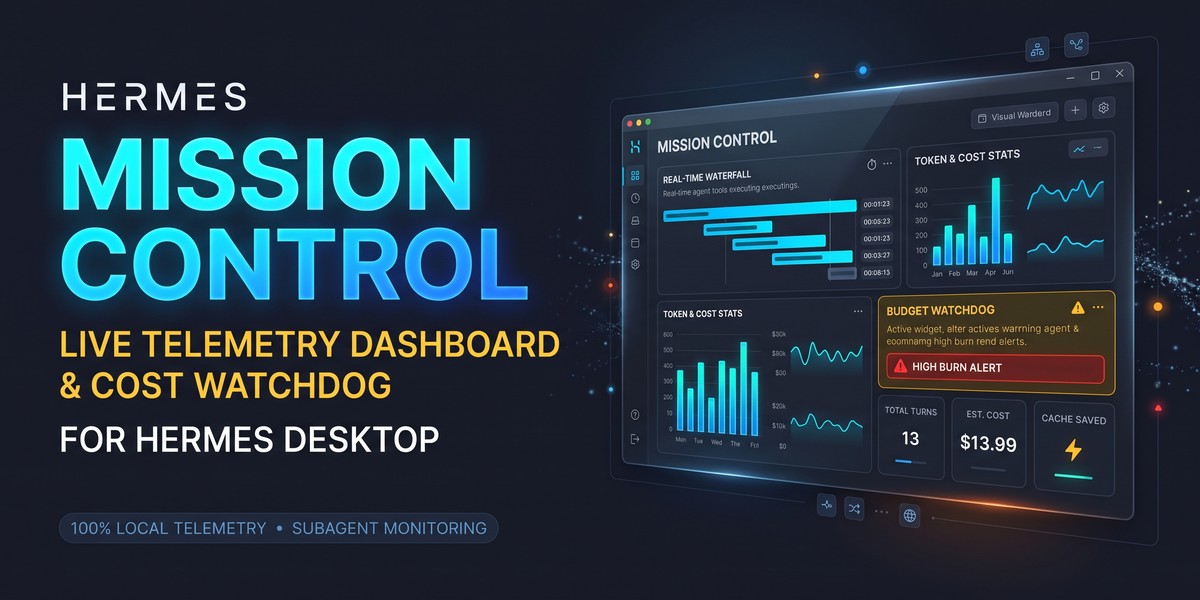
A live mission-control dashboard inside Hermes Desktop. Every tool call, model call, subagent and approval streams into one pane while your agent works — with token and estimated-cost meters, a ⚡ prompt-cache badge, and a budget watchdog that flags a runaway turn before it burns money.
Read-only. Everything stays on your machine.
Quick start
hermes plugins install rohitdanda/hermes-mission-control --enable
- Restart the gateway: ⌘K → Restart gateway (the hooks load at gateway start).
- In Hermes Desktop open Capabilities → Plugins, click Rescan, and switch Mission Control on (Desktop halves ship off by default).
- Run any task. Watch the Mission Control pane on the right, the ◎ chip in the status bar, or open the full page from the sidebar / ⌘K → Mission Control: Open dashboard.
Requires Hermes 0.21.6 or newer.
What you see
| Card | What it shows |
|---|---|
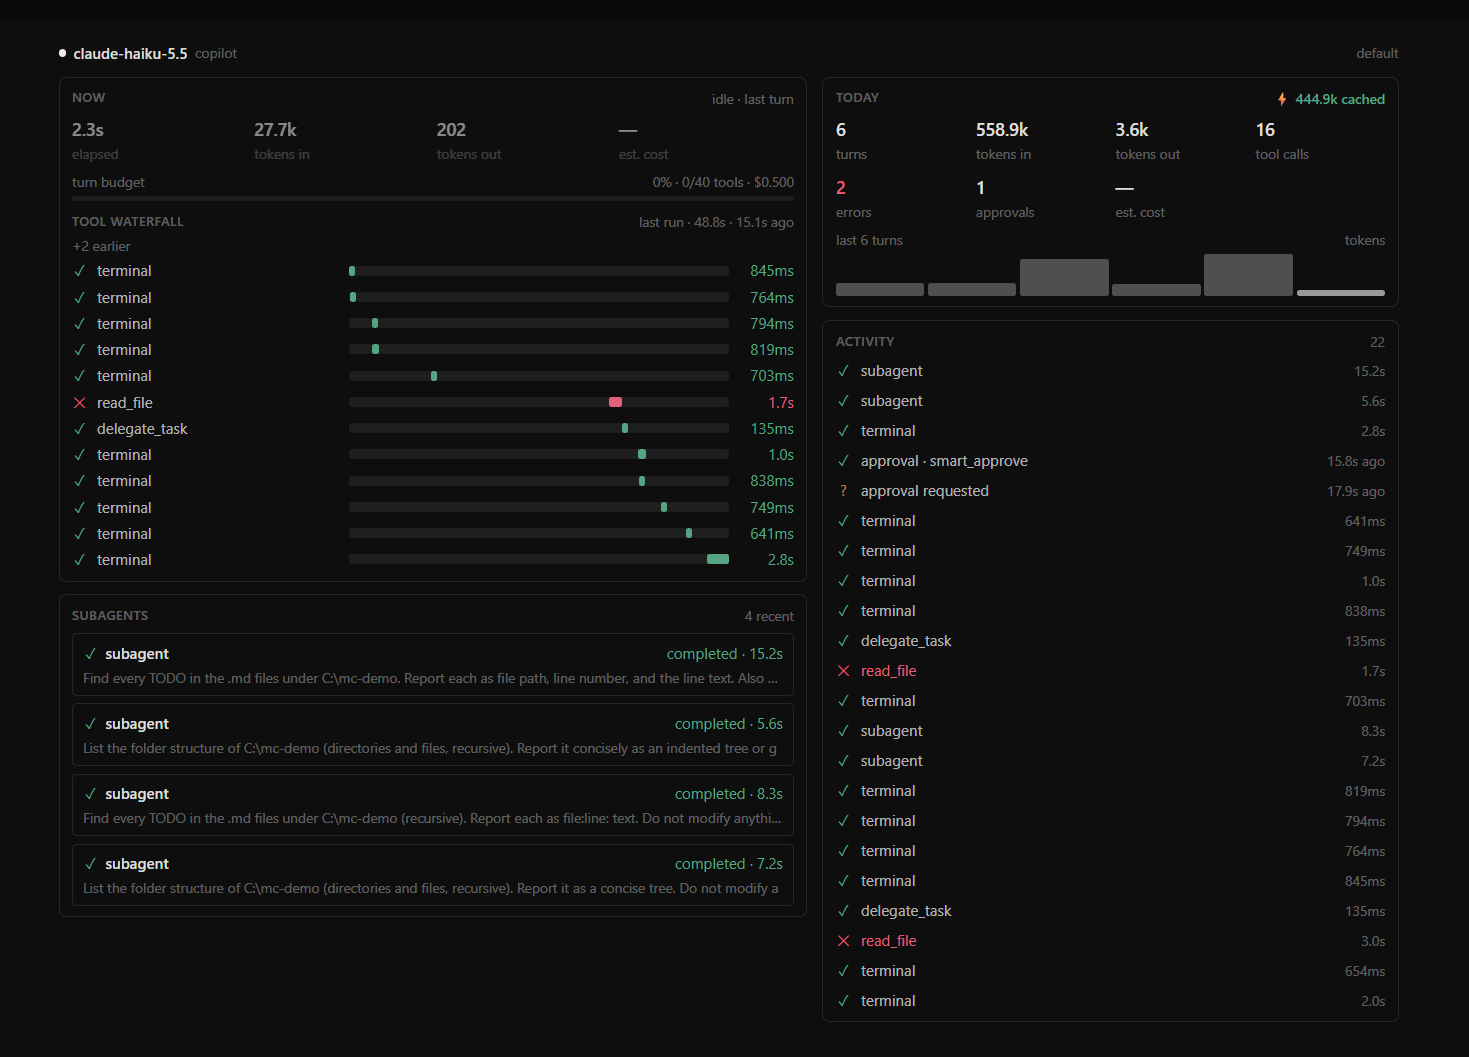
| Now | Turn state (thinking / running N tools / N subagents working / idle), elapsed time, tokens in and out, estimated cost, and the turn budget bar — amber past 80 %, red past 100 % with a pulsing ⚠ High token burn banner. A 🔁 Possible loop banner appears when one agent calls the same tool with identical arguments several times in a row (3, 5 or 10 — your choice). |
| Tool waterfall | Every tool call as a bar on one timeline. Running calls pulse and grow with a live stopwatch; finished calls snap to green ✓, red ✕ (hover for the error type) or grey ⊘ (cancelled/blocked). The last run stays on screen until the next one. |
| Subagents | One card per delegated subagent, ticking while it runs — parallel subagents tick side by side. Click a finished card for its summary. |
| Today | Turns, tokens, tool calls, errors (with retried model calls on hover), approvals and denials, estimated cost, the ⚡ cached badge with cache hit rate, and a sparkline of the last 12 turns. |
| Activity | A feed of tool calls, failed or retried model calls, subagents and approval decisions. |
| Status-bar chip | Spinner while the agent works, plus today's tokens and cost; turns amber or red when the current turn is over budget. Click it to open the full page. |
When a turn crosses a budget you get one in-app toast for that turn (plus an OS notification if Hermes is in the background). If you have a desktop pet, it speaks up once when a possible loop appears. Both only alert — they never stop or change the agent.
What counts as a loop. Same tool and identical arguments, called back to back by one agent. Reading five different files is normal work and never trips it; parallel subagents each keep their own count, so interleaved work can't add up to a false alarm. A loop inside a subagent is reported on the turn that delegated it.
How it works
agent turn (gateway process)                      Hermes Desktop
┌─────────────────────────────────────┐          ┌──────────────────────────────┐
│ 8 observer hooks  ──►  in-memory     │  push    │ desktop/plugin.js            │
│ (tools, model calls,   store (bounded│ ───────► │  pane · chip · page ·        │
│  subagents, approvals) deques, lock) │  + poll  │  ⌘K commands · settings      │
│ dashboard/plugin_api.py              │ ◄─────── │                              │
│  GET  /api/plugins/mission-control/  │          │                              │
│       snapshot · events?since=N      │          │                              │
│  POST /api/plugins/mission-control/  │          │                              │
│       reset                          │          │                              │
└─────────────────────────────────────┘          └──────────────────────────────┘
- Collect. Eight read-only observer hooks (
pre_tool_call,post_tool_call,post_api_request,api_request_error,subagent_start,subagent_stop,pre_approval_request,post_approval_response) write into a small in-memory store. Every hook is fail-open: it can never raise into the agent loop. - Deliver. Each event is pushed to the Desktop the instant it happens through Hermes's public plugin event bridge (
hermes_cli.plugin_events). The pane also polls/events?since=N(every second while work is running) so nothing is missed, and refreshes/snapshotfor the aggregates. Events carry a sequence number, so overlapping feeds never double-count. - Roll up. A subagent's model and tool calls count toward the turn that delegated it, so a turn's cost and budget include its subagents.
- Forget. The store is bounded (500 events, 100 turns, 50 subagents) and lives in memory only. Daily counters roll over at local midnight; everything clears on gateway restart or from ⌘K → Mission Control: Reset today's stats.
Cost estimates
Costs are labelled est. on purpose. They come from a bundled per-1M-token price table (input, output, cache read, cache write) whose rows mirror the official-docs pricing snapshot that ships with Hermes 0.22.5 (Anthropic, OpenAI, Google, DeepSeek, Amazon, Fireworks), plus a few community rows. As of 2026-11-10.
- Model names are normalised before lookup, so
anthropic/claude-sonnet-4.6,claude-sonnet-4-6-20250414and Bedrock ids all match. - A model that isn't in the table shows —, never a misleading $0.
- Subscription providers (GitHub Copilot, Codex) show a list-price equivalent; the tooltip says so. Your plan isn't billed per token.
- Context-tier surcharges (for example >200k-token Gemini prompts) are not modelled.
Settings
Settings → Plugins → Mission Control
| Setting | Default | |
|---|---|---|
| Show estimated cost | on | Hide every cost figure. |
| Alert on high token burn | on | The once-per-turn toast / OS notification. |
| Turn cost budget | $0.50 | Per-turn estimated cost that turns the bar red. 0 = off. |
| Turn tool-call budget | 40 | Tool calls in one turn before the bar turns red. 0 = off. |
| Activity feed size | 30 | 15, 30 or 60 events. |
| Loop alert threshold | 5 | Identical calls in a row before the 🔁 banner: 3, 5, 10 or off. |
| Pet speaks up on loops | on | One line in the desktop pet's bubble when a possible loop appears. |
| Reset today's stats | | Clears counters, turns and the feed. |
Troubleshooting
| You see | Do this |
|---|---|
| Connect a gateway to stream telemetry | Hermes Desktop isn't connected to a gateway. Start or reconnect it. |
| Backend not loaded | The Python half isn't enabled: hermes plugins enable mission-control, then ⌘K → Restart gateway. On a very old Hermes, update. |
| Hooks are not reporting to this gateway | Restart the gateway after enabling. If dashboard.turn_isolation is on, turns run in a separate child process the dashboard can't read; turn it off to use Mission Control. |
| Nothing appears in Plugins | Capabilities → Plugins → Rescan, then switch it on. |
| Edits to desktop/plugin.js don't show | Desktop runs a copy; Rescan refreshes it (a linked checkout refreshes automatically). hermes plugins doctor mission-control reports a stale copy. |
With plugins.isolation: host, hooks and routes both run in the plugin host and the dashboard works through polling (about a second behind instead of instant).
Disclosure
In-process only: reads observer-hook telemetry and serves it over Hermes's own plugin API to the connected Desktop. No third-party network calls, no shell commands, no background processes, no stored credentials, no telemetry of its own.
In detail:
- Reads: only the hook payloads Hermes passes to it. It does not record tool arguments, tool results, prompts or replies — only tool names, statuses, durations, error types, token counts, model and provider names, subagent goals and summaries (truncated), and approval decisions. To spot repeated calls it keeps a short, irreversible hash of each agent's most recent tool arguments, in memory only.
- Writes: nothing to disk. Telemetry lives in process memory; your settings live in the Desktop's own plugin storage.
- Network: none of its own. Events reach the Desktop through Hermes's local plugin API and event bridge.
- Agent: never written to. No tools, no middleware, no approval answers.
Development
python tests/test_store.py        # store, rollup, loops, pricing, routes, hook parity (stdlib only)
python tests/test_push.py         # the Desktop push bridge
python tests/e2e_http.py          # mounts the routes on Hermes's real web server (Hermes venv)
python tests/desktop_state.py state.json
node tests/desktop_smoke.mjs state.json <dir with react, react-dom, nanostores>
hermes plugins validate .
desktop_smoke.mjs loads the real desktop/plugin.js with React 19 and a stub SDK, renders every surface, and fails on any React warning. A Hermes checkout's apps/desktop folder works as the module directory.
To develop against a live Desktop, link the checkout into your plugins folder — Desktop then hot-reloads every save of desktop/plugin.js:
ln -s ~/src/hermes-mission-control ~/.hermes/plugins/mission-control          # macOS / Linux
New-Item -ItemType Junction -Path "$env:LOCALAPPDATA\hermes\plugins\mission-control" -Target .   # Windows
License
MIT — see LICENSE.
README from the reviewed commit 3f0b984; it updates when the author re-pins.