jp-charts for Hermes Agent
Charts for Hermes Agent that you can paste into a report or send to a chat, and trust.
Ask Hermes for a chart and you get a PNG built to be read on a phone, with a MEDIA: line that Hermes' chat gateways use to attach the file to the reply. Before the image is handed over, the plugin reads every bar, point and printed number back from the finished figure and compares it with the values it parsed from your data.
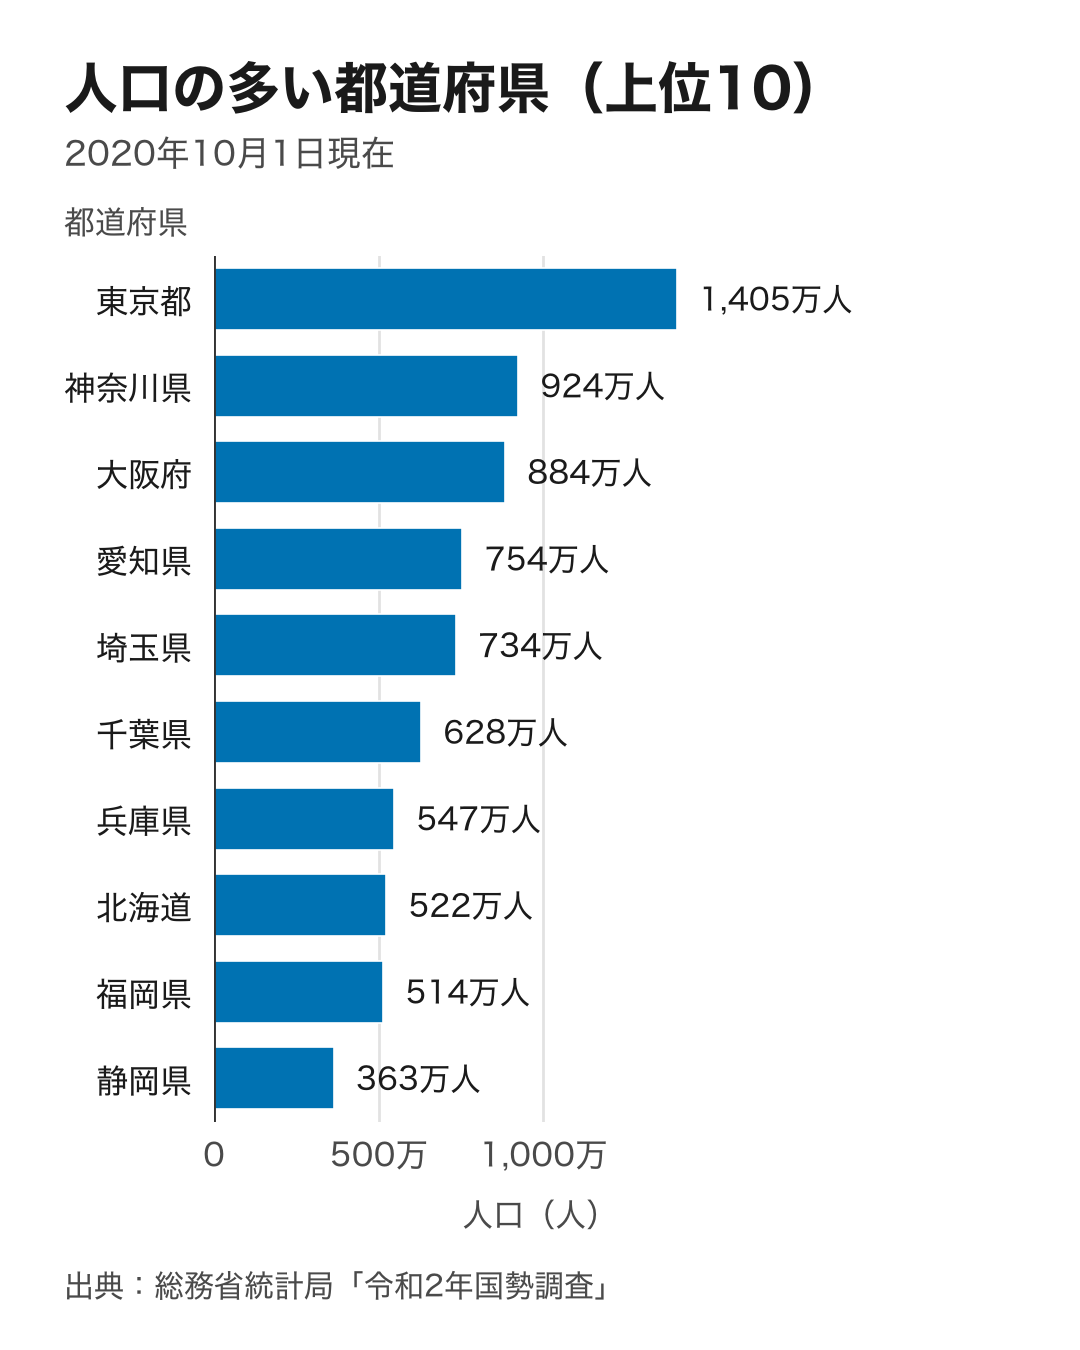
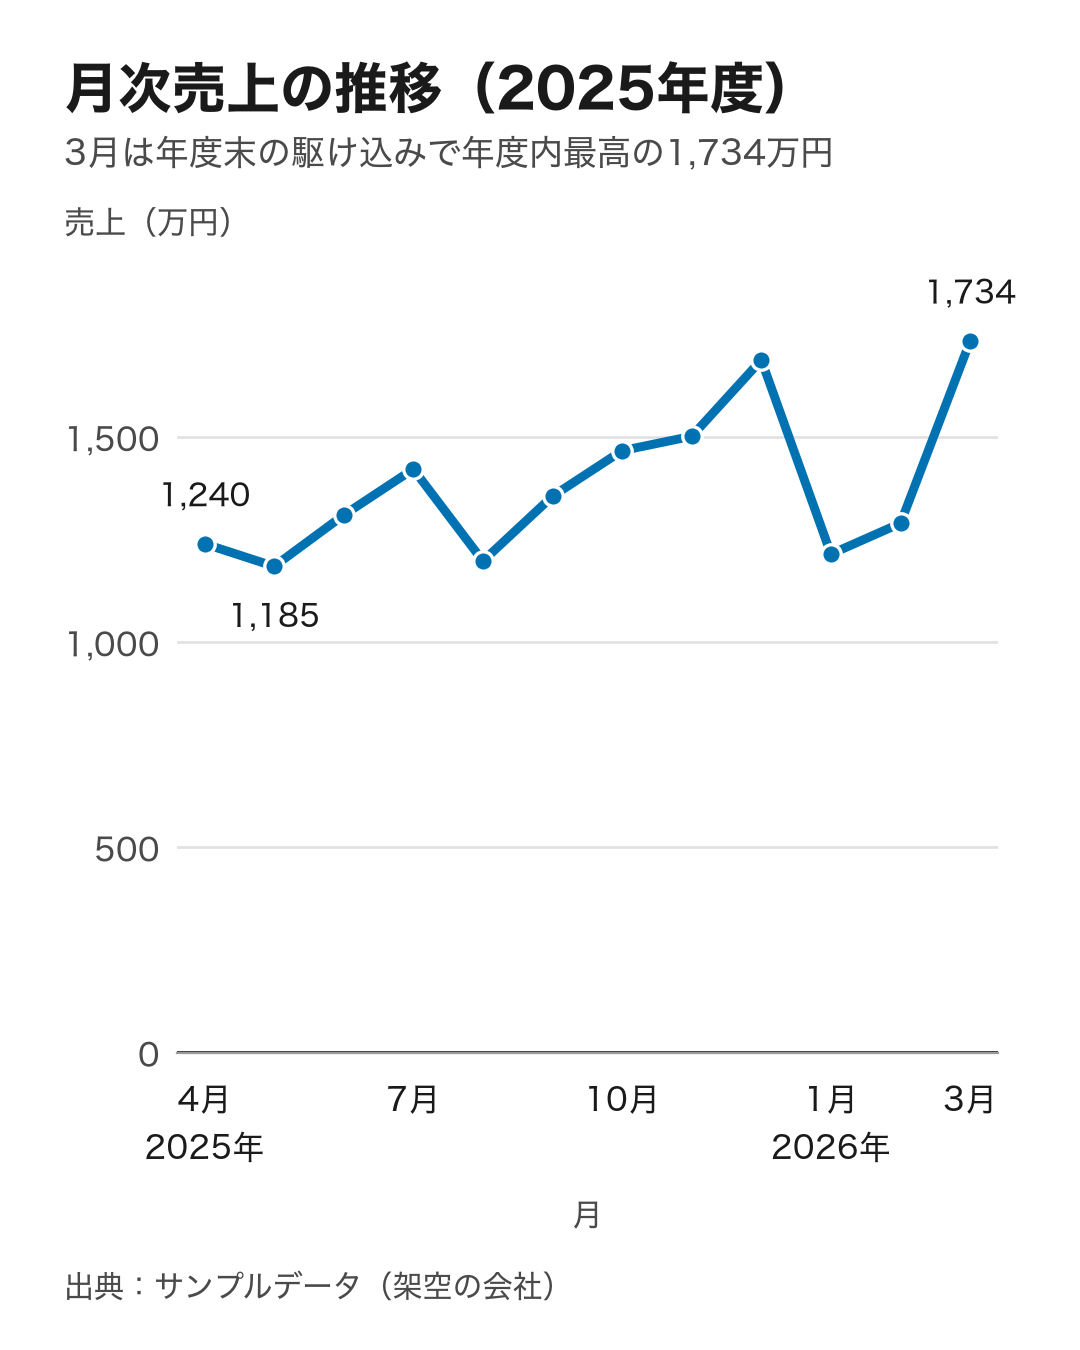
| Population, top 10 (horizontal bar) | Monthly sales (line) | Sales mix (100% band) |
|---|---|---|
 |
 |
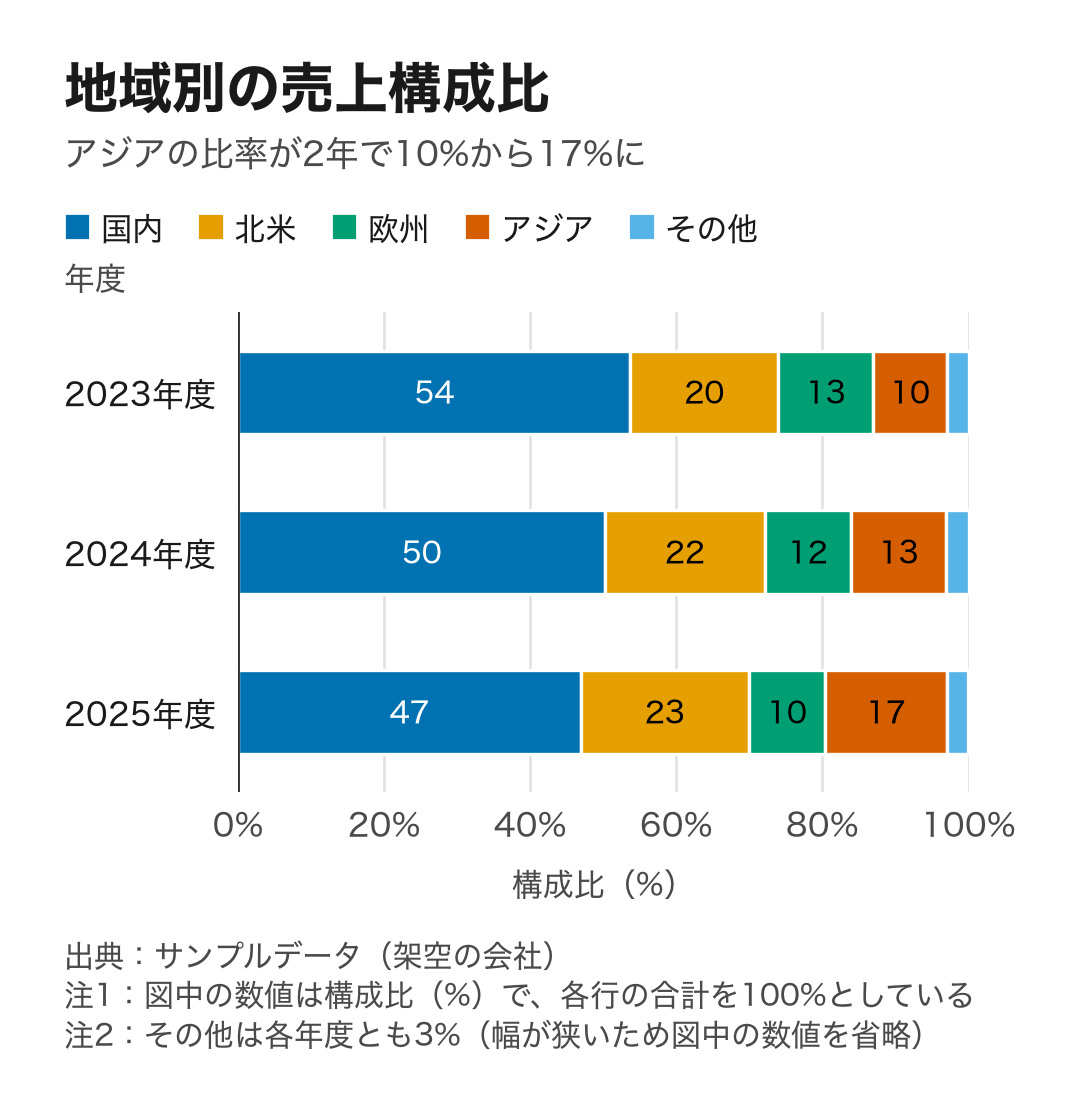 |
The population chart uses the 2020 census figures (Statistics Bureau of Japan). The other two use sample data from a fictional company. All three images are the plugin's real output at the default mobile size (1080 px wide; the band chart is shorter because it has only three rows).
Install
Needs Hermes v0.21.4 or later (hermes --version); if yours is older, run hermes update first.
-
Install the plugin and its Python dependencies (matplotlib, plus a Japanese font package):
hermes plugins install TakeshiTGAL/hermes-plugin-charts --yes-deps --enableOnce the plugin is listed in the Hermes plugin catalog,
hermes plugins install jp-charts --yes-deps --enableworks too. To try a local copy instead, runhermes plugins install "file://$PWD" --yes-deps --enableinside a clone of this repository. -
Start a new chat. If you use Telegram, Slack or another chat app, restart the gateway too:
hermes gateway restart -
Ask for a chart, in a chat or from the terminal:
hermes chat -Q -q "Make a bar chart of this table. Unit: 万円. Source: our sales system.
店舗,売上
新宿,1450
梅田,1010
博多,720"
In a terminal the reply gives the PNG's path. In a chat app the reply carries the
MEDIA:line for the gateway to attach.
No API key, no Node.js and no headless browser. Charts are drawn inside Hermes' own Python process with matplotlib.
What you get
- Readable on a phone. The default canvas is 1080×1350 (4:5), and every text on it is set at a font size of at least 30 px (about 11 pt when the image fills a phone screen). A chart with only a few rows is drawn on a shorter canvas instead of leaving empty space.
wide(1600×900, for slides) andsquare(1080×1080) are one setting away. - Ready to attach in chats. The tool result carries a
MEDIA:/path.pngline. Hermes' gateways turn that line into an attachment; Hermes' own platform notes list Telegram, Slack, Discord, WhatsApp, Signal, Matrix, Mattermost and the desktop app. Not yet tested: whether the photo actually arrives in a real Telegram, Slack or LINE chat. What the tests confirm is that Hermes'extract_media(the gateway step that pulls attachments out of a reply) picks up the chart's file from the final reply. If the model forgets to include the line, the plugin's output hook adds it at the end of the turn (not in the terminal, the TUI, ACP, SMS, the API server or webhooks). LINE needsLINE_PUBLIC_URLset, because LINE only accepts images from a public HTTPS URL. Chatwork has no built-in Hermes adapter: images only arrive there if the Chatwork platform plugin you use supports file upload. - Every chart is labeled. Value-axis titles always include the unit, and every chart prints its source.
unitandsourceare required, and an error tells the model what to put there (for numbers the user typed: "Data provided by the user"). - Japanese that never turns into boxes. The plugin uses a Japanese system font when one is installed (BIZ UDPGothic, Hiragino Sans, Noto Sans CJK JP, Yu Gothic, Meiryo), and otherwise IPAexGothic, which comes with the
matplotlib-fontjadependency. A character that no font can draw (an emoji in a title, for example) is reported as an error naming the field. It is never drawn as a box. - Japanese number conventions. Thousands separators everywhere. Large numbers become 万 and 億 (
1,405万,3.2億, or1.4Min English), with one scale shared by every label on a chart. Input like1,234,1234,3.5万,1億2000万,△120(negative) and(2,500)is read correctly.-,…,xand***mean "no value", as they do in e-Stat tables, and the chart says so in a note. - Colors that work for color-blind readers. The Okabe–Ito palette is used throughout. Neighbouring parts are separated by white gaps, lines carry distinct marker shapes, and up to four lines are labeled at their ends, so no one has to match colors to a legend.
- Honest by default. Bars always start at zero: a request to cut the axis is refused, with the reason. Line charts start at zero unless you opt out, and then the chart says so. Pie, donut, 3D and dual-axis charts are not offered, and the error points to the alternative. Shares are recomputed from the raw values so each band adds up to exactly 100%. Numbers are rounded half up (12.5 → 13), as Japanese reports expect. Numbers inside a band step down from
53.7%to54%to54(one style per chart; a note then says the numbers are percent). A number that still does not fit is printed beside its band with a leader line, and if there is no room at all, a footnote gives the value. - Checked before it is returned. After drawing, the plugin reads the figure back and compares it with the values it parsed from your data: each bar's length, each segment's start, each line point, every data label and every axis tick (parsed back to a number), that each mark sits on its own category label, and that zero is on the axis. The result includes this check together with a table of parsed and drawn values. If any check fails, no image is returned. Titles, footnotes and captions are not checked, and a wrong
unitis not something the check can see, so read the result'schartsummary when the unit matters. - Your data as it is. Pass a list of rows, CSV, TSV copied from Excel, a Markdown table, JSON, or the path of a local
.csv,.tsv,.txtor.jsonfile (UTF-8 or Shift_JIS). Title and footnote lines around a table are skipped. A result in the shape{columns, rows, unit, source}(what an e-Stat plugin'sestat_get_datareturns) can be passed asdataunchanged, and its unit and source are used. - Errors that say what to do next. Every error has a
code, awhere(for exampledata row 4 (data.values[3]), column '人口': '七百万' is not a number) and afix.
Tools
| Tool | What it does |
|---|---|
chart_render |
Draws the chart, checks it, saves the PNG to Hermes' image cache and returns path, media, alt_text (use it as the caption) and verification. |
chart_validate |
The same arguments, without drawing. It shows how the table was read (categories, series, unit, sort) or what is wrong. |
chart_types |
When to use each chart type, the encodings each one needs, accepted data formats, presets and limits. |
A request looks like this:
{
  "data": {"text": "月,売上\n2025-04,1240\n2025-05,1185\n2025-06,1310"},
  "chart_spec": {
    "chart_type": "line",
    "title": "月次売上の推移",
    "unit": "万円",
    "source": "社内販売管理システム",
    "encodings": {"x": {"field": "月"}, "y": {"field": "売上"}}
  },
  "output": {"preset": "mobile"}
}
Chart types: bar (sorted largest first; grouped when there are several y columns; horizontal when labels are long), line (dates sorted oldest to newest; gaps for missing periods), stacked_bar, and share_bar (100% bands, used instead of a pie chart). x is always the category or date column, and y the numbers, for horizontal bars too. The plugin swaps them back if a model mixes them up. Limits: 8 series, 40 bars, 30 stacks, 15 bands, 500 line points. Each limit comes with an error that suggests top_n or an "Other" group.
Settings
Set these under plugins.entries.jp-charts.settings in config.yaml, or in the desktop app's plugin settings.
| Key | Default | Meaning |
|---|---|---|
preset |
mobile |
mobile 1080×1350, square 1080×1080, wide 1600×900 |
locale |
auto |
Language of the source line, notes and number units (ja, en). auto follows the data. |
font_path |
empty | A .ttf, .otf or .ttc file to try first |
auto_attach |
true |
Add the chart's MEDIA: line to a chat reply when the model forgot it |
What this plugin does on your machine
- No network access at run time. It sends no telemetry and stores no credentials. The only downloads happen at install time, when Hermes installs matplotlib and matplotlib-fontja from PyPI.
- Reads files only when the model passes
data.path: any absolute path the Hermes process can read, limited to.csv,.tsv,.txtor.jsonfiles up to 10 MB. Hidden files and folders (names starting with.) and everything under the Hermes home folder are refused. Parts of a file it reads come back to the model (inchart_validate's preview and in error messages), like any tool output. - Writes PNGs to Hermes' image cache (
<HERMES_HOME>/cache/images, or<HERMES_HOME>/image_cacheon an older install that still uses it). Run outside Hermes, it writes tohermes-chartsin the system temp folder. matplotlib keeps its own font cache in its config directory. - Output hook. It registers one hook,
transform_llm_output. At the end of a turn on a platform that attaches files (Telegram, Slack, Discord, email, the desktop app, cron deliveries), the hook appendsMEDIA:lines for charts rendered in that session that the reply does not mention. It changes nothing on cli, tui, acp, sms, local, api_server and webhook turns, nothing when the reply already attaches one of the charts, and nothing whenauto_attachis off. Other plugins can use the same hook. Hermes calls everytransform_llm_outputhook in load order and keeps the first reply text that one returns, so on a turn where another plugin also rewrites the reply, only one of the two changes is kept. On turns where this plugin has nothing to add, it returns nothing and does not get in the way. - No shell commands and no background processes. It does not change matplotlib's
rcParams, so other tools in the same process draw as before. It does add IPAexGothic (and yourfont_path, if set) to matplotlib's shared font list, and while a chart is being drawn it briefly listens to matplotlib's warnings to catch missing glyphs.
How it compares
This plugin's request format (data, plus chart_spec with encodings that map x/y/color to columns) and its render/validate/list split follow microsoft/flint-chart (MIT). See NOTICE. lieflat-charts was read for comparison only. Its license (PolyForm Noncommercial 1.0.0) does not allow reuse in an MIT plugin, and nothing was taken from it.
The table describes flint-chart at commit 683d5de and lieflat-charts at commit eace082, as read on 2026-10-02. Both projects move quickly; check their current READMEs.
| flint-chart | lieflat-charts | jp-charts | |
|---|---|---|---|
| What it is | Chart spec compiler (JS library) + MCP server | Agent skill (SKILL.md) + HTML templates |
Hermes plugin (3 tools + 1 hook) |
| Output | Interactive MCP App view by default; PNG/SVG as MCP image content; backend specs (Vega-Lite, ECharts, Chart.js, Plotly, Excel) | HTML charts and full-page HTML reports | PNG file plus a MEDIA: line for Hermes' chat gateways to attach |
| Runtime | Node.js (npx flint-chart-mcp) |
The agent writes HTML | Python inside Hermes (matplotlib); no browser, no Node |
| Chart variety | Large (dozens of templates, 10 visual themes) | Large (its catalog.md lists 63 chart types; 12 report layouts) |
Small on purpose: bar, line, stacked, 100% band |
| Phone-first defaults | Default canvas 400×320 (baseSize, per its agent skill) |
Designed for pages | 1080×1350, every font size at least 30 px |
| Japanese text | Bundles Liberation Sans + DejaVu Sans (packages/flint-mcp/src/render/fonts.ts, no Japanese glyphs) and also loads system fonts |
Templates and docs in Chinese and English; Japanese shows if the viewer's browser has a Japanese font | Japanese system font, or IPAexGothic from the matplotlib-fontja dependency; missing glyphs are an error |
| 万/億 and Japanese number input | No formatter for them in the source | No formatter for them in the templates | Read and written (3.5万, △120, 1,405万) |
| Unit and source on the chart | Optional unit per field (shown beside values or in the axis title); title and subtitle; no source field |
Treats sources as part of the design | Both required and always printed |
| Checks the drawn values | validate_chart checks the spec before compiling |
Contrast and hierarchy checks described in the skill's rules | Reads back every bar, point, label and tick and compares them with the parsed values; refuses to return a mismatch |
| Data in | data.values, local JSON/CSV/TSV via data.url |
Whatever the agent loads | Rows, CSV, Excel TSV, Markdown tables, JSON, local files (UTF-8 or Shift_JIS), e-Stat results |
| License | MIT | PolyForm Noncommercial 1.0.0 | MIT |
flint-chart and lieflat-charts offer far more chart types and visual styles. This plugin covers fewer cases: the charts people put in business reports and chat threads, drawn so they can be pasted as they are, and checked against the parsed numbers before they are returned.
Development
python -m venv .venv && . .venv/bin/activate
pip install -r requirements-dev.txt
pytest -q
python scripts/render_examples.py   # after any visual change: refreshes the README images
hermes plugins validate . --install-deps
Tested with hermes-agent at commit 0a374d1 (2026-10-02; latest release tag at that point: v2026.9.24).
日本語
Hermes Agent に「このデータをグラフにして」と頼むと、スマホでそのまま読める PNG が返ってきます。返事には MEDIA: の行が付き、Hermes のチャット接続はこの行を見て画像を添付します。画像を渡す前に、描き上がった図から棒の長さ・点・数値ラベル・目盛を読み戻し、データから読み取った値と1つずつ突き合わせます。一致しないときは画像を返しません(題名や単位の書き間違いまでは確かめられないので、単位は結果の chart 欄で確かめてください)。
導入(3手)
Hermes v0.21.4 以上が必要です(hermes --version で確認)。古ければ先に hermes update を実行してください。
hermes plugins install TakeshiTGAL/hermes-plugin-charts --yes-deps --enable(プラグインカタログに載った後はhermes plugins install jp-charts --yes-deps --enableでも入ります。手元のコピーで試すときは、clone したフォルダでhermes plugins install "file://$PWD" --yes-deps --enable)- 新しいチャットを始める。チャットアプリで使う場合は
hermes gateway restart - 頼む。端末からなら
hermes chat -Q -q "この表を棒グラフにして。単位は万円、出典は販売管理システム。(表を貼る)"
API キー、Node.js、ヘッドレスブラウザはどれも要りません。
報告資料で困らないための既定
- 軸と単位: 値の軸の題には必ず単位を付けます(例: 人口(人))。単位がないと描きません。
- 出典: 必ず図の下に入れます。ユーザーが打ち込んだ数字なら「ユーザー提供データ」と入ります。
- 数字の書き方: 桁区切りを入れ、大きな数は万・億で書きます(1,405万、3.2億)。図の中のラベルは同じ桁数にそろえます。入力の「3.5万」「1億2000万」「△120」「1234」もそのまま読めます。
- e-Stat の記号: 「-」「…」「x」「***」は値なしとして扱い、図の注にもそう書きます。
- 色: 色覚の多様性に配慮した Okabe–Ito の配色です。区切り線と形の違う印を使い、折れ線は線の端に系列名を書くので、色だけに頼りません。
- 誤解を招く形を避ける: 棒グラフは必ず0から描きます。円グラフの代わりに帯グラフ(各行の合計が100%)を使います。端数は四捨五入です。帯の中の数値は、入らなければ「53.7%」→「54%」→「54」と図全体で同じ書き方のまま短くします(%を外したときは注にそう書きます)。それでも入らない数値は引き出し線を付けて帯の外に書き、それも無理なら注に値を書きます(例:「その他は各年度とも3%(幅が狭いため図中の数値を省略)」)。
- 文字化けしない: 日本語のシステムフォントがあればそれを、なければ依存パッケージ matplotlib-fontja に入っている IPAex ゴシックを使います。どのフォントにもない文字(絵文字など)は四角で描かず、どの欄にあるかをエラーで返します。
資料に貼るときのコツ
- スライド用: 「横長で」と頼むと 1600×900(16:9)で描きます。正方形なら「正方形で」。
- ファイルの場所: PNG は
<HERMES_HOME>/cache/images(通常は~/.hermes/cache/images)に保存され、結果のpathにフルパスが入ります。 - 折れ線の縦軸: 既定は0から始めます。小さな変化を読み取りたいときは「縦軸を0から始めないで」と頼めます。そのときは図の注に「縦軸は0から始まっていない」と自動で入ります。棒グラフは0から始めないと差を誇張するので、頼まれても0から描きます。
対応しているデータ
- 行のリスト
- CSV、Excel からコピーした表(タブ区切り)、Markdown の表、JSON
- ローカルの .csv / .tsv / .txt / .json(Shift_JIS 可。隠しファイルと Hermes のホームフォルダの中は読みません)
- e-Stat プラグインの結果(そのまま渡せます)
表の上の題名の行や、下の「注1)」の行は飛ばして読みます。
エラーの例
type_mismatch: data row 4 (data.values[3]), column '人口': '七百万' is not a number
fix: Fix or remove those cells. Thousands separators, full-width digits, 万/億 and △ for negatives are fine; leave a cell empty (or '-') when there is no value.
送り先ごとの注意
- 実機での確認はまだです: 本物の Telegram・Slack・LINE に写真が届くかは確かめていません。確かめたのは、Hermes の
extract_media(返事から添付ファイルを拾う処理)がグラフのファイルを拾うところまでです。 - Telegram・Slack・Discord・デスクトップアプリ: Hermes の説明では、
MEDIA:の行の画像は写真として送られます。 - LINE:
LINE_PUBLIC_URL(外から見える HTTPS の URL)の設定が必要です。Hermes の LINE 接続は、公開 URL の画像しか送れないためです。 - Chatwork: Hermes に標準の接続がありません。使っている Chatwork 用プラットフォームプラグインがファイル送信に対応していれば届きます。
License
MIT. See LICENSE. Credits and third-party notices are in NOTICE.