
Token & Cost Meter
English · 简体中文
A Hermes Desktop plugin that shows, live in the status bar, how many tokens the focused session has burned, what that costs in USD, and how much the prompt cache is saving you. Everything it observes is folded into a local per-day ledger, so the numbers are still there after you restart Hermes.
Click the chip for the full ledger: today / 7 days / this month / all time, broken down per model, with cache hit rate and savings per row.
Why it exists
Hermes' gateway reports live token counters, but the cost side has two gaps:
- Only 7 providers report pricing.
hermes_cli/models_pricing.pyfetches live rates foropenrouter,nous,ai-gateway,novita,deepinfra,fireworksandkilocode. Everything else — notably subscription/OAuth routes like GitHub Copilot — returns an emptypricingblock, so a naive reader just shows "pricing unavailable". - The counters reset. They live in the agent process, so quitting Hermes zeroes them. Nothing backfills them from the database on restart.
This plugin closes both: a bundled rate table from models.dev
covers the providers Hermes doesn't price, and a ctx.storage ledger keeps the
history.
Install
From this repository
hermes plugins install IT-dreamer/token-cost-meter
Hermes will note that this is a custom, unreviewed source — it is not (yet) in the official plugin catalog. To pin an exact commit rather than tracking the default branch:
hermes plugins install IT-dreamer/token-cost-meter --ref <40-char-commit-sha>
Manually
Copy desktop/plugin.js into your desktop plugin directory:
mkdir -p ~/.hermes/desktop-plugins/token-cost-meter
cp desktop/plugin.js ~/.hermes/desktop-plugins/token-cost-meter/
Then in the Hermes desktop app: ⌘K → Reload desktop plugins.
No entry in config.yaml is needed — this is a pure front-end plugin.
What you get
Status bar chip — input/output tokens, session cost, cache hit rate, and today's running total. Hover for details.
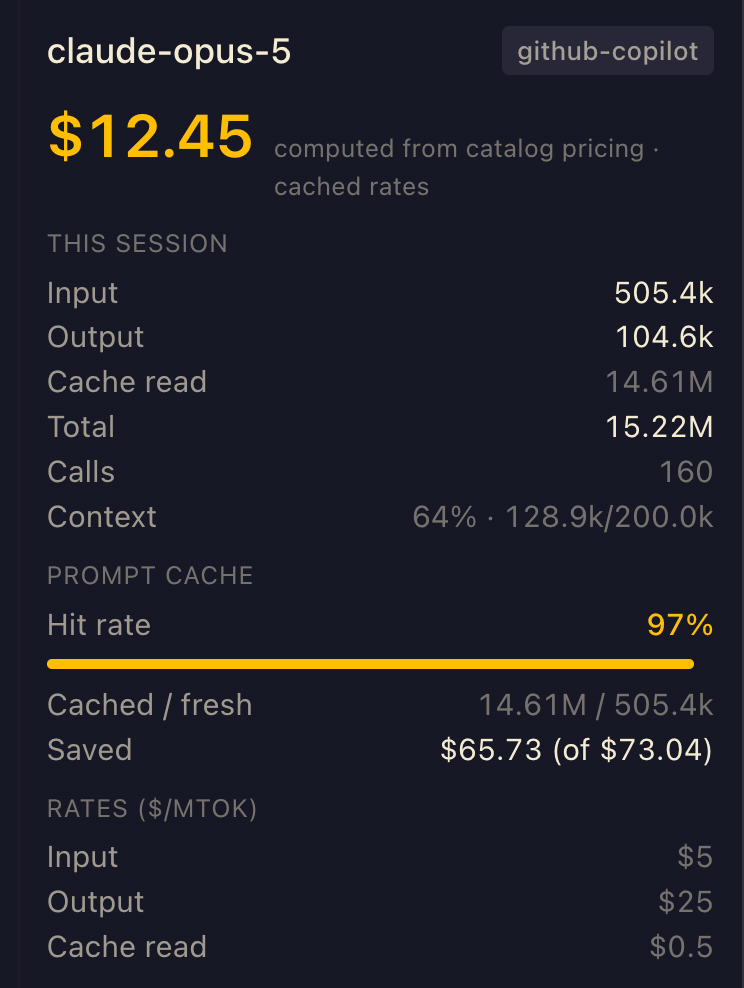
Right-hand pane — this session's token breakdown, the rates being applied, a prompt-cache section (hit rate, cached vs fresh, dollars saved), and subtotals for today / 7 days / this month.
Ledger page — a sortable per-model table across four time ranges, with a grand total, aggregate cache hit rate and total savings.
Bilingual: English and 简体中文, following the app's language setting.
How the cost is computed
Rates are resolved in this order, and the pane always tells you which one it used:
| # | Source | Shown as |
|---|---|---|
| 1 | The active provider's live catalog pricing | computed from catalog pricing |
| 2 | Rates remembered from an earlier live hit | cached rates |
| 3 | The bundled models.dev table | estimated from models.dev rates |
| 4 | Another provider's rates for the same model id | ⚠ rates borrowed from <slug> |
Step 4 is a deliberate last resort with a visible warning. Several providers
list the same model id at different prices (Nous and GitHub Copilot both carry
claude-opus-5, at $4/$20 and $5/$25 per Mtok respectively), so borrowed rates
are never passed off as your own route's.
If the gateway itself reports a cost_usd, that always wins — it is the only
figure that isn't an estimate.
Token streams
Hermes' CanonicalUsage defines prompt = input + cache_read + cache_write, so
each stream is billed at its own rate rather than counted twice:
inputandcache_write→ the input ratecache_read→ the cache rate (falling back to input when a model has none)output→ the output rate
Cache savings
Savings is what the cached tokens would have cost at the full input rate, minus what they actually cost at the cache rate. Cache writes bill at the input rate either way, so they're neutral and excluded.
The gateway only sends a rounded cache_hit_pct, not raw cache token counts, so
the cached volume is recovered from prompt - input when the provider splits
them, or derived from prompt × hit% when it doesn't. The derived path inherits
the gateway's integer rounding — expect sub-percent drift.
The ledger
Gateway counters are cumulative per live agent and reset on restart, /new and
/reset. The ledger diffs each reading against a per-session::model snapshot
and accumulates only the delta; a counter that moves backwards is read as a
fresh run and adopted whole. Totals are kept per calendar day (local time, not
UTC) for 120 days.
Intake comes from message.complete and session.usage events, with a 30s
sweep of the focused session as a safety net.
Two honest limitations:
- No backfill. Only usage seen while the plugin was running is recorded. Sessions from before you installed it aren't in the ledger.
- Desktop only. Usage from the CLI/TUI doesn't reach this ledger.
Data lives in the plugin's own ctx.storage namespace. Nothing is sent
anywhere.
Refreshing the rate table
The bundled rates are a snapshot taken when the pinned commit was cut. To regenerate them from the models.dev catalog Hermes already keeps on disk:
python3 scripts/gen-rates.py
This rewrites the FALLBACK_RATES literal in desktop/plugin.js in place.
(The desktop plugin loader rejects relative imports, so the table can't live in
its own module.) Currently ships ~1130 models across 21 providers.
Accuracy
These are estimates, not billing data. Catalog $/Mtok rates are list
prices; subscription routes bill a flat monthly fee regardless of what this
shows. Read a Copilot figure as "what this would have cost at API list price".
License
Apache-2.0