echarts-in-chat
Render a chart inline in a Hermes Desktop assistant message — zoomable, legend-filterable, resize-aware — through the official Desktop Plugin SDK transcript-directive slot.
A plugin registers a named directive with TRANSCRIPT_DIRECTIVE_AREA; the model
addresses it by emitting a paragraph of the form ::echarts{...}, and the host
mounts this plugin's React component in its place. The plugin never touches the
app's markup, never injects a script, and loads no remote code.
Install
This repository is a Hermes unified package (plugin.yaml plus a
desktop/plugin.js entry point).
Install from GitHub:
hermes plugins install Tommy00748/hermes-plugin-echarts-in-chat
Or clone it manually into the plugin package root:
git clone https://github.com/Tommy00748/hermes-plugin-echarts-in-chat \
  ~/.hermes/plugins/echarts-in-chat
Then enable it in Desktop → Capabilities → Plugins (or ⌘K → Reload desktop plugins) and restart the app if the message stream does not pick it up.
Usage
In an assistant message, emit a directive paragraph:
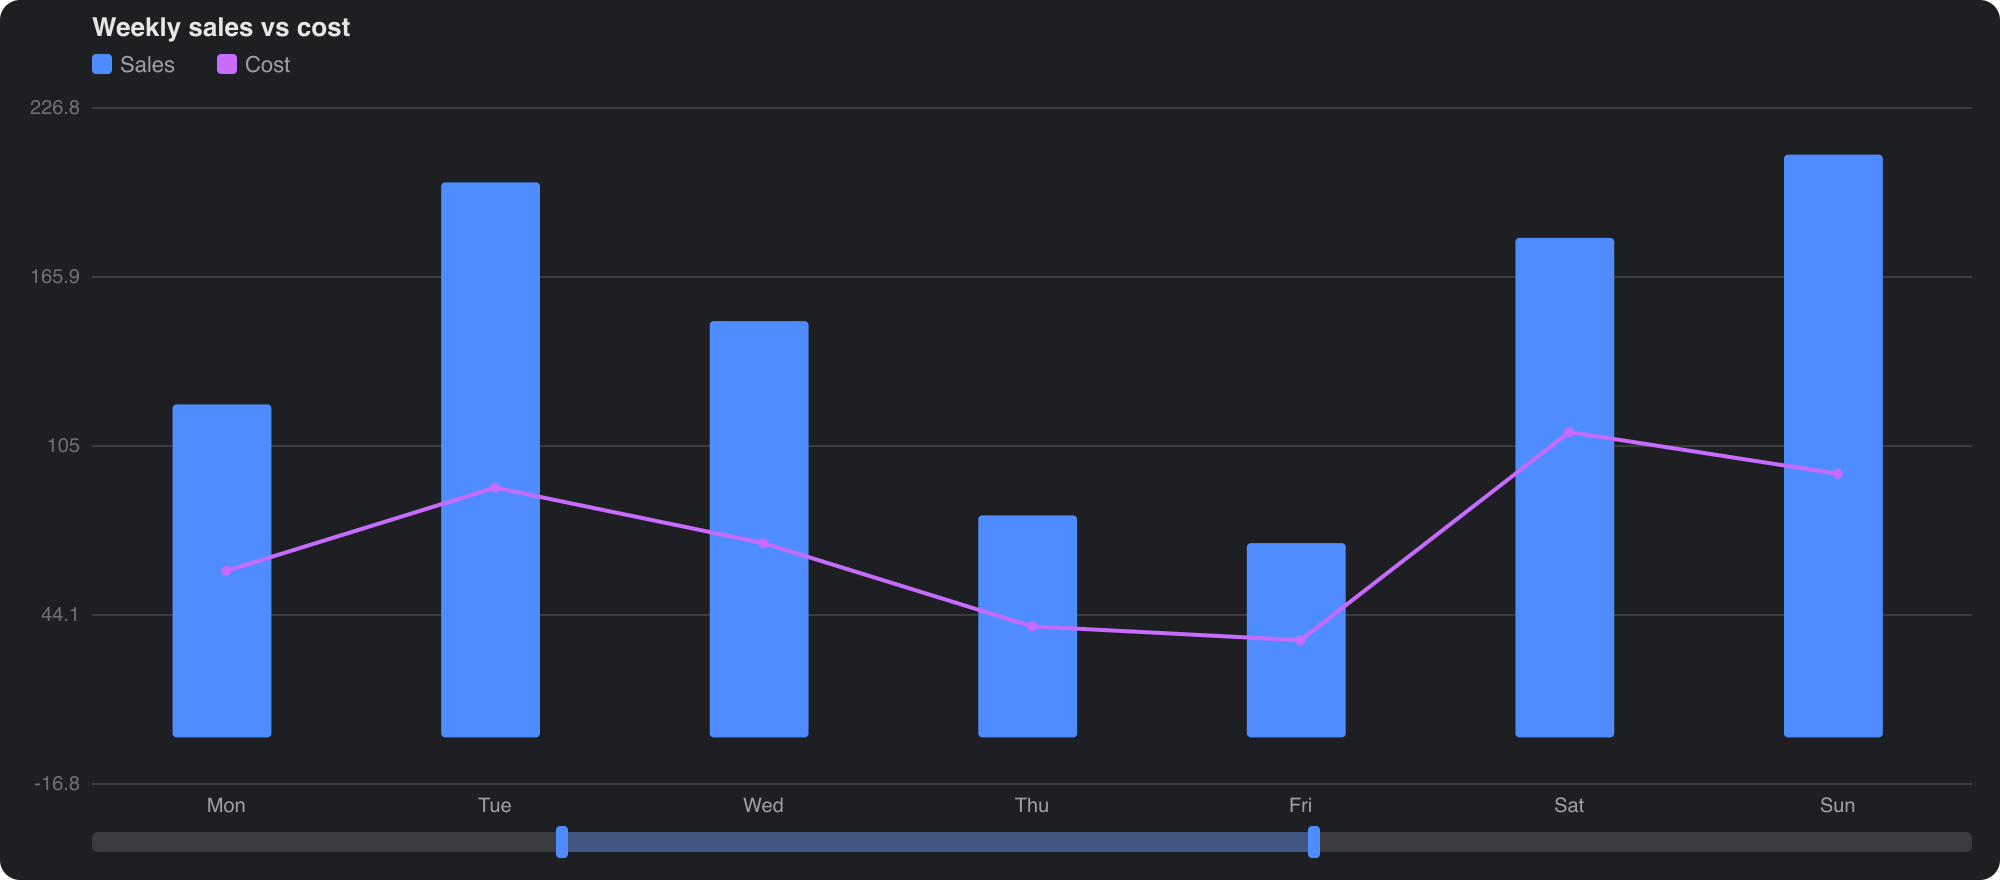
::echarts{labels="Mon,Tue,Wed,Thu,Fri" values="120,200,150,80,70" type="bar" title="Weekly sales"}
Multi-series (bar and line can be mixed):
::echarts{labels="Mon,Tue,Wed,Thu,Fri" series="Sales:bar:120,200,150,80,70;Cost:line:60,90,70,40,35"}
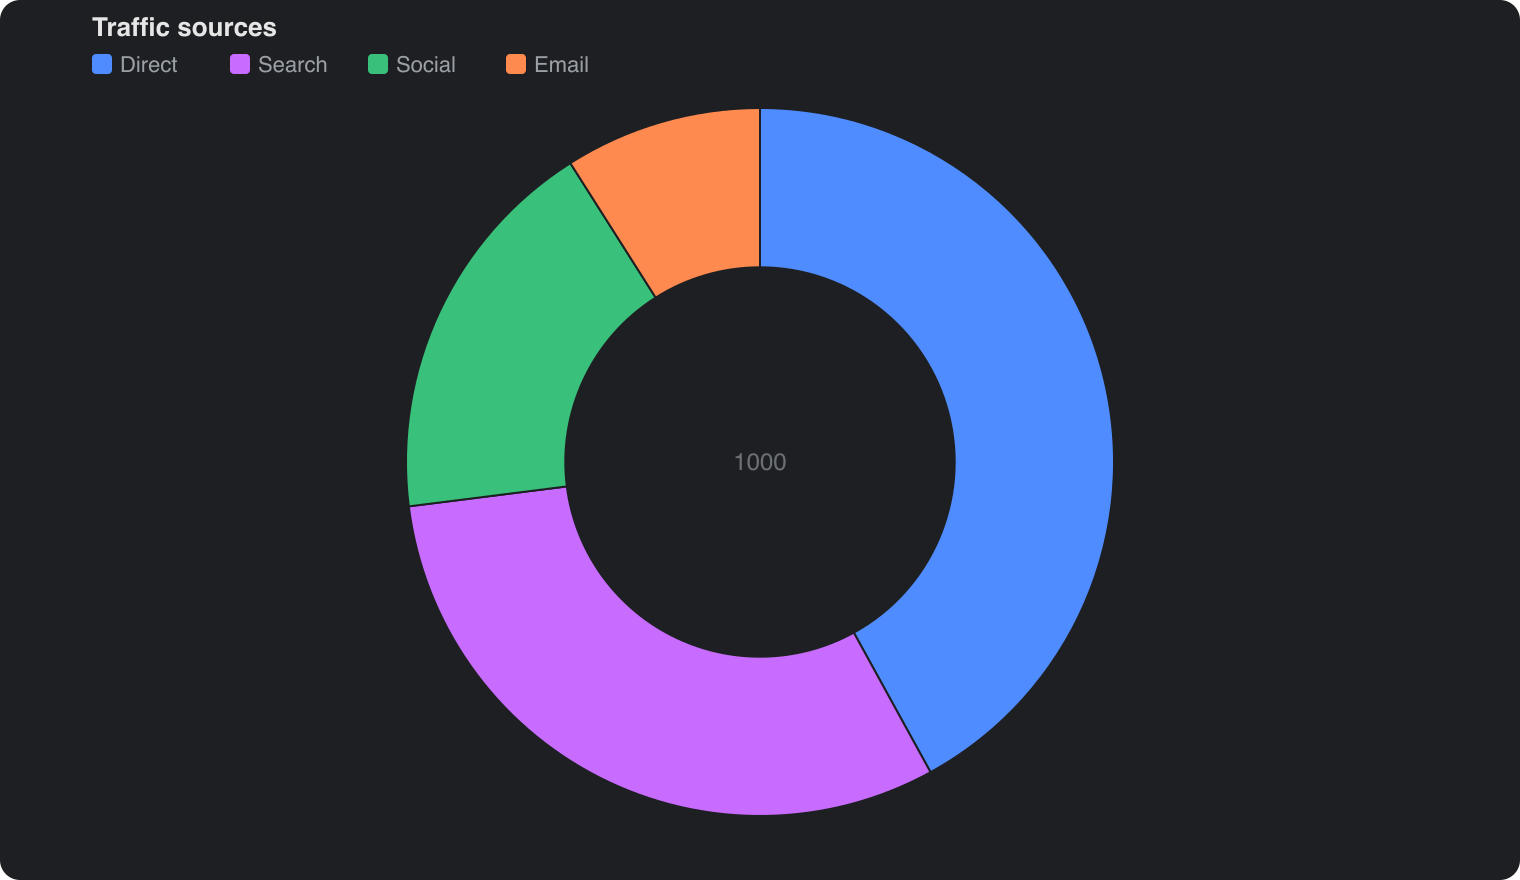
Pie / donut, taller, zoom always on:
::echarts{labels="Direct,Search,Social,Email" values="420,310,180,90" type="pie" height="420"}
Directive attributes
| Attribute | Meaning |
|---|---|
labels |
comma-separated category names (x axis, or pie slice names) |
values |
comma-separated numbers — single series |
name |
single-series name (used with values) |
series |
name:type:v1,v2,... entries separated by ; — multi series |
type |
default series type for entries without one: bar | line | pie |
title |
optional chart title |
height |
optional pixel height, clamped to 280–560 (default 400) |
zoom |
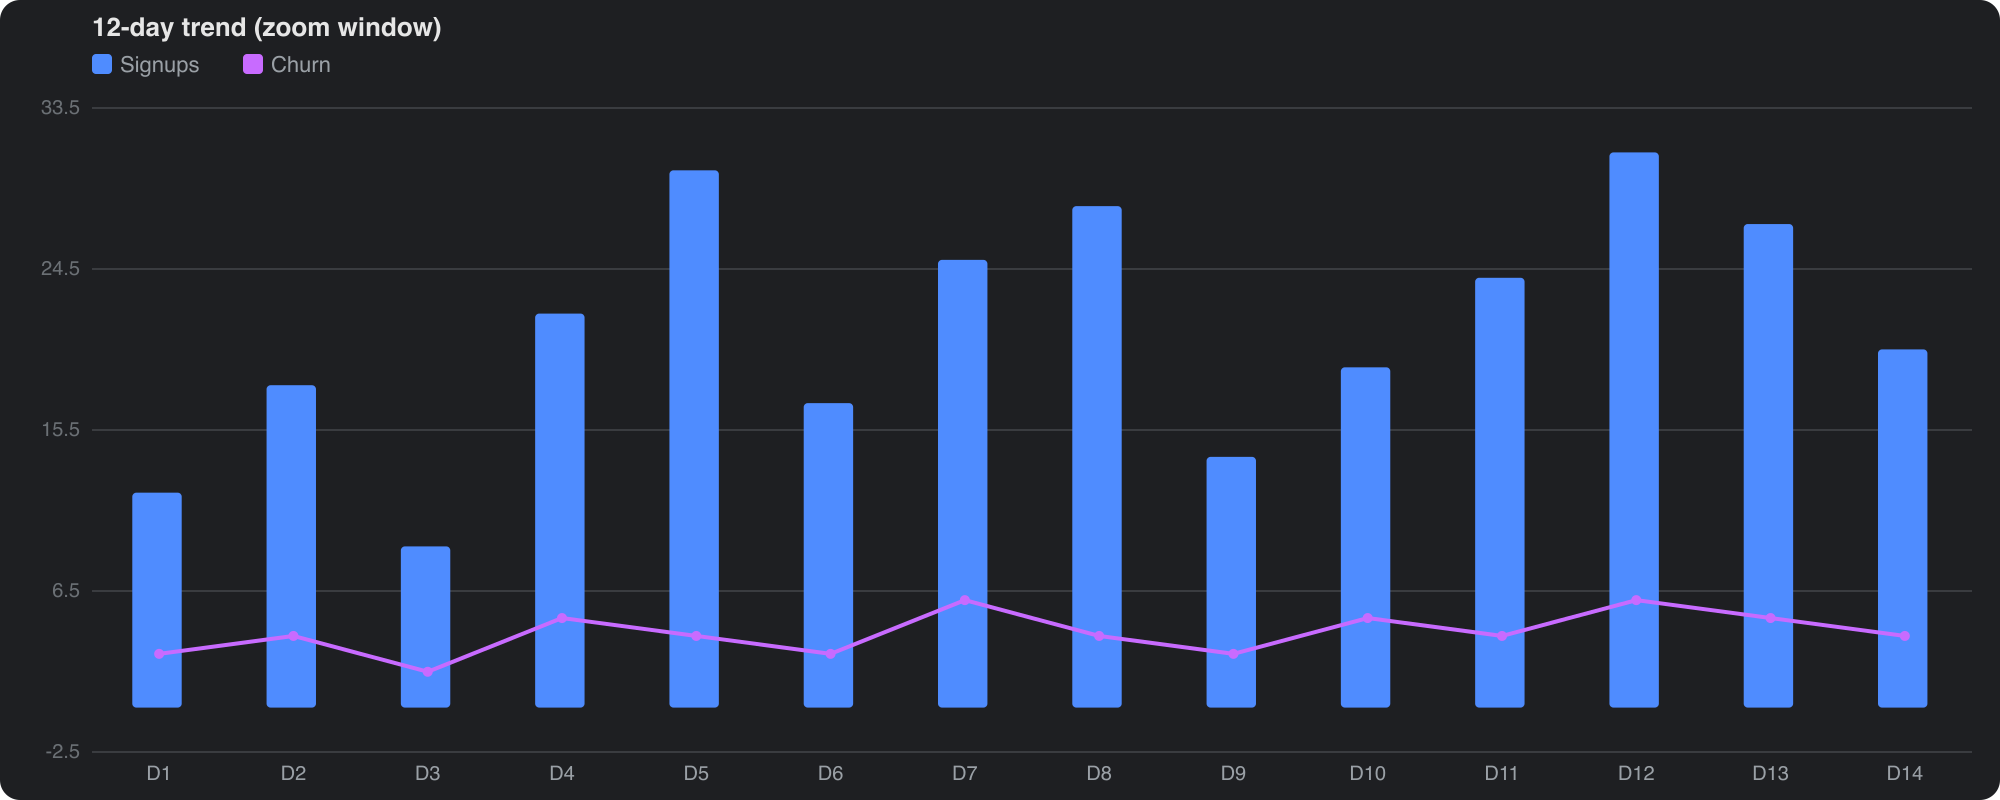
"true" / "false" — the dataZoom slider (default: on when > 10 categories) |
The host's directive grammar does not allow { or } inside the attribute
body, so a raw ECharts option JSON cannot be passed; the values are given as
plain attribute lists instead.
Interactions
- Zoom (dataZoom) — the slider under the plot: drag the window to pan, drag either handle to resize, or scroll the wheel over the plot. Defaults on for more than 10 categories.
- Legend filter — click a legend item to hide/show that series or slice.
- Resize-aware — a
ResizeObserveron the chart's own element re-lays the SVG out when the message column changes width. - Tooltip — hovering a category shows each visible series' value.
- Height override —
heightis clamped to 280–560px. - Multi-instance safe — every directive is its own React component with no shared global state, so two charts in one message can never interfere.
Disclosure (what this plugin does to your machine)
- Network calls. None. The chart is drawn locally as inline SVG. There is no CDN, no fetch, and no telemetry.
- Reads/writes outside the plugin's own data. None. It renders only the directive it was handed; it does not read or modify the transcript, the app's stores, or any files.
- Shell commands. None.
- Background processes. None. While a chart is mounted it keeps a
ResizeObserveron its own container and a wheel listener for zoom; both are removed when the component unmounts. There is nosetInterval. - Stored credentials / env vars. None.
Why there is no ECharts and no ```echarts code fence
v1 of this plugin scanned the message stream with a document.body
MutationObserver, replaced matching <pre> blocks, and loaded ECharts from
jsDelivr with a <script> tag. Hermes catalog admission rule 8 refuses both of
those moves, and the Desktop runtime loader only resolves @hermes/plugin-sdk
and react* (a relative import of a vendored file cannot resolve against the
blob: module base), so an external chart library cannot be loaded at all.
The sanctioned way to put content in the message stream is the SDK's
transcript-directive slot — which is addressed by ::name{...}, not by a fenced
code block, and whose attribute grammar forbids {/}. This version therefore
draws the chart itself in SVG and is triggered by ::echarts{...}. It keeps the
behaviour the original demonstrated (zoom, legend filter, resize, height
override) but drops the ECharts library and the code-fence trigger; a
plugin-accessible fenced-code-block renderer hook would be needed to restore
that exact interface.
License
MIT — see LICENSE.