Operations
A plugin for Hermes Agent by Nous Research.
Pages
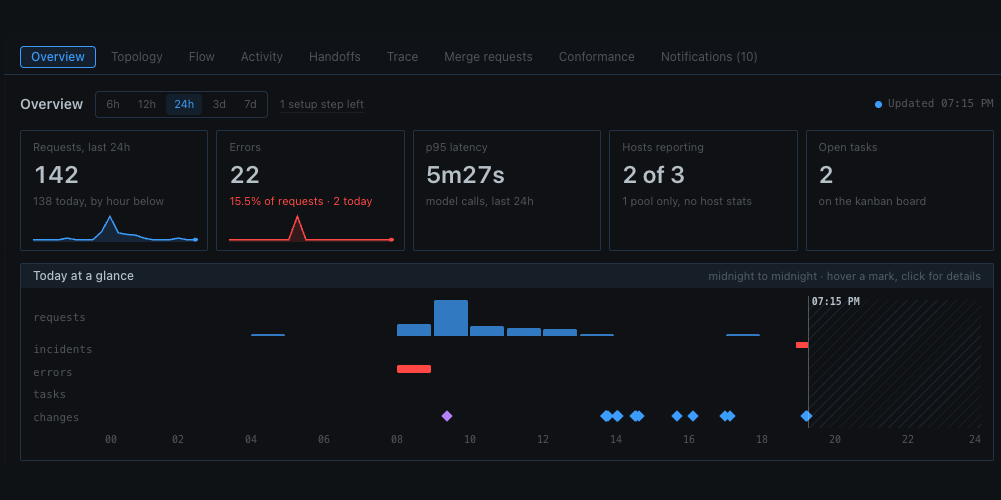
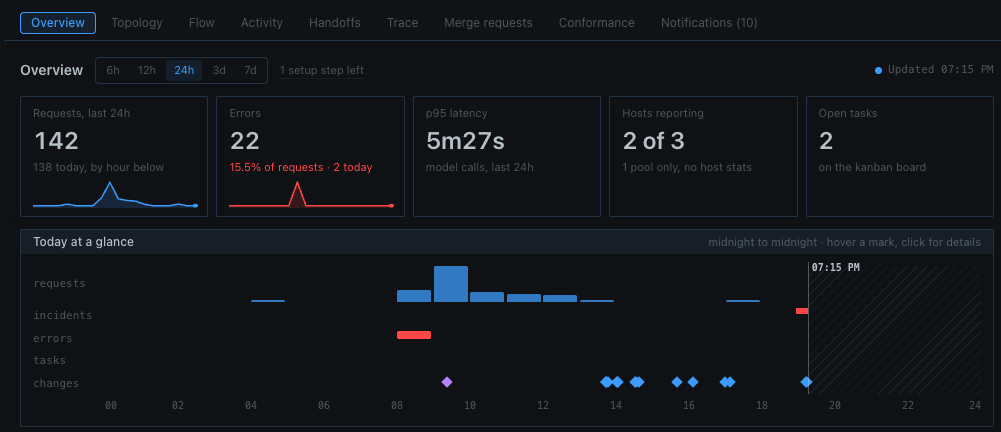
- Overview: start here. Vitals for the range you pick, an hourly strip of today's requests, errors, incidents and changes, and a Needs attention list that includes kanban cards stuck waiting on a person. Click any mark on the strip to see what happened in that hour and jump to it on another page.
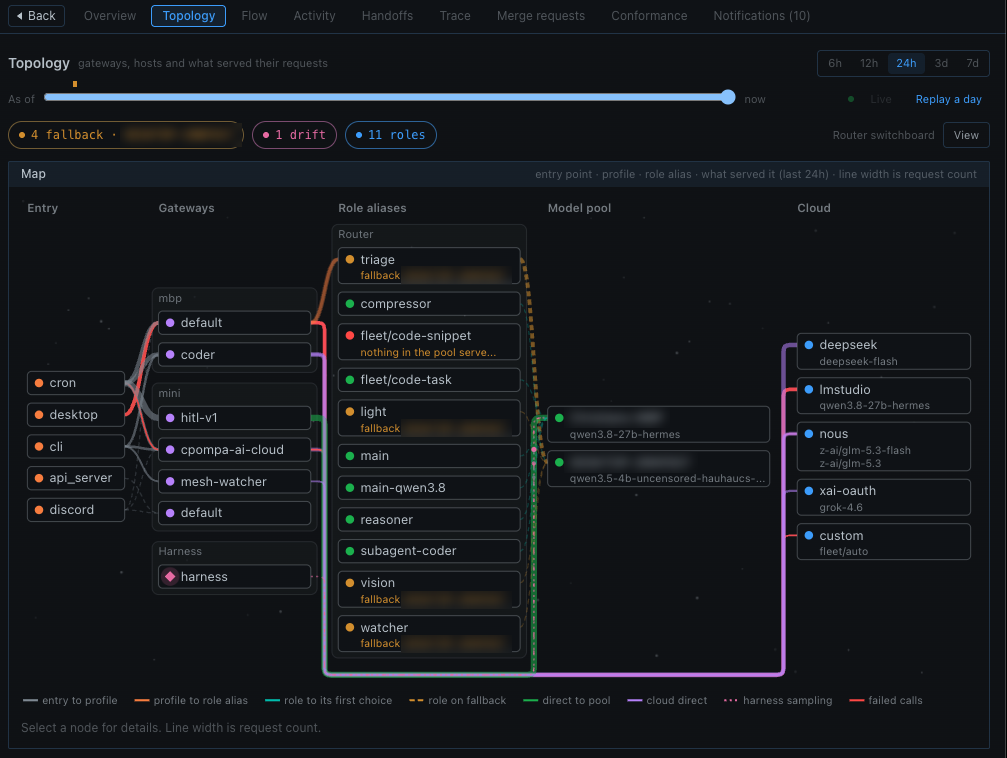
- Topology: a map of your hosts, their gateways, and the devices and cloud providers that answered their requests, with line width showing where the traffic went. Chips over the map count what is wrong right now. Select a node to see what would stop if it went down, or drag the track under the map to see the fleet as it was at any moment in the window.
- Flow: follows each request from where it came in, through its profile and model, to what actually answered it. Pick any bar to isolate that traffic and see where it came from, where it went, and how much of it failed.
- Activity: a running log of errors, gateways going down and coming back, kanban events, host check changes, merged MRs and model loads, grouped by hour and filtered by kind. Open an entry for its raw lines, or turn on Activity summaries to have each one read as a plain sentence.
- Handoffs: who handed work to whom, one lane per agent, for kanban cards and subagents. Move an open card along without leaving the page: hand it to a profile, schedule it, answer a blocked worker, mark it done or close it.
- Trace: opens a session as a timeline of its model calls and the subagents it started. "Why it took this long" names the longest wait and the calls that ran well past their usual time, measured against similar calls from the week before, and says what each failed call ran into.
- Merge requests: open and recently merged MRs, who each one is waiting on and for how long, and where its pipeline stands.
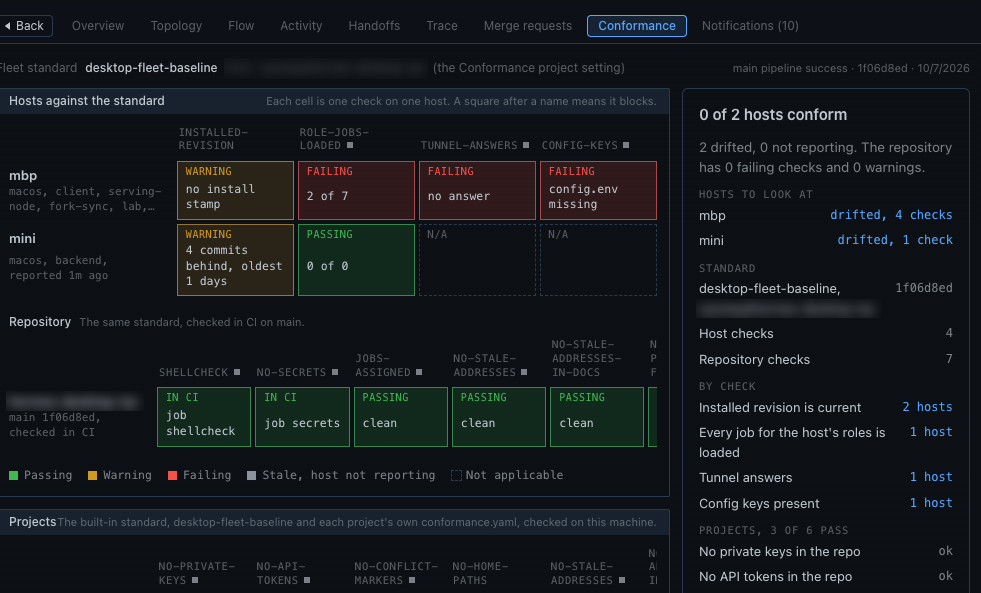
- Conformance: checks your projects for leaked keys and tokens, merge conflict markers and hard-coded home directories with no setup, and once you have a standard, your hosts against it. Hand a failing project or host to a profile as a fix card in one step, or fix a host yourself from the command shown.
- Notifications: every alert the page has raised, with an unread count, since Hermes Desktop has no notification center of its own. A new install also finds its setup checklist here.
Links on every page open the same host, model, card or session on another page, already selected.
Install
Install in Hermes Desktop opens Desktop's install dialog with this plugin filled
in. Where the link does not open (GitHub does not follow hermes:// links), paste it into your
browser's address bar, or run it on macOS:
open "hermes://plugin/install?repo=https%3A%2F%2Fgithub.com%2Fc-pompa%2Foperations-hermes-desktop-plugin.git%23plugins%2Foperations"
Or from the command line:
hermes plugins install "https://github.com/c-pompa/operations-hermes-desktop-plugin.git#plugins/operations" --enable
Or in Hermes Desktop: Capabilities > Plugins > Install from Git, with the same URL. Then:
- Switch Operations on in Capabilities > Plugins (Hermes installs a desktop page switched off, and remembers the choice).
- Restart the dashboard so it mounts the backend.
hermes plugins update operations pulls new versions. A fresh install opens a
"Set up Operations" checklist on the Notifications tab (see Setup checklist).
Page details
Overview
- Vitals for the chosen window, plus hosts with the model pool and recent activity.
- Today strip: an hour's requests, errors and tasks, incidents and changes. Hover a mark to
see what it is; click it for a side drawer with links to the map at that time, Flow, Trace,
Handoffs or the merge request. An hour's drawer follows its lane: requests show where they came
from, the models asked for and what served them, with a line on how many failed; errors show
the failed calls; tasks link to Handoffs. A health finding about a session links to the session
in Trace and to its profile on the map over the session (its last hour if it ran longer).
Incidents and each group of failed calls have Fix this, as on a Needs attention card: a new
chat or a kanban card for a profile, with what failed, where, its sessions and how to check.
An incident about a model router role with no loaded model is handed to an agent, not fixed by
the plugin: a new chat on a profile whose config has
rolectl-mcpundermcp_serverswithROLECTL_MCP_ALLOW_WRITE: "1"(on the profile's default model, changeable with the model pill), or a kanban card for that profile — with the role's candidates, the context it needs and how to check, any change under Hermes's approvals. When no profile qualifies, a once-a-day toast and the role drawer offer a chat that adds rolectl-mcp to this profile's config, or the lines to copy. - Errors in an hour are grouped by what failed and where (error text, entry point and host, profile, model, what served it), each linking to its newest failing session in Trace, its model in Flow and the map over that hour.
- Needs attention includes kanban cards waiting on a person (blocked or in triage), with the worker's reason and a link to the card in Handoffs.
- Changes and news: merged MRs and model loads.
Topology
The map
- Each host's gateways (with state), the hosts (live or stale, with load and memory), and what served their requests: pool devices with their loaded models, and cloud providers. Line width is request count; lines with no requests are faint, and each line's failed share is red.
- A host whose newest conformance report fails a check is outlined as drifted.
- Select a node for its details and its blast radius: the entry points and requests cut off if it went down, and the models that were also served elsewhere.
Model router roles (when hermes-model-router answers)
- The Roles table lists each role alias's candidates in order, which are loaded, and the device serving it now. A role's name selects it on the map; "See its traffic" opens it in Flow.
- The blast radius adds what each affected role does by the router's own rules: it moves to its first candidate still loaded, or with none, a strict role stops and any other falls through to its last candidate.
- The router is found the way its own plugin finds it:
MODEL_ROUTER_URL(else its default address), with the Model router token setting (orMODEL_ROUTER_TOKEN) when the router asks for a bearer token. Without one, the page says so and shows observed traffic only.
Chips and sheets
- Chips over the map count the loud issues (a gateway down, a device offline, a host that stopped reporting, a role nothing serves), each fallback group, drift, and the router's role aliases. A fallback role with no requests stays off the chips.
- A chip opens the issue drawer (why, the facts, a command to copy where one fixes it, links) and selects its node; the roles chip opens the Roles sheet.
- Under the map, What changed and Roles start collapsed, with counts and kind pills on the header. Repeats on one node (a gateway restarted four times) fold into one chip with a count and time span; a restart that takes several platforms down at once counts once.
Replay
- Drag the track under the map to any moment, or pick a recent change (a state change, a model load or unload, a host starting to drift) to see the fleet as it was, with that node selected.
- "Replay a day" plays the last 24 hours, a bucket every quarter second, then returns to live.
Layouts and View
| Layout | Shows |
|---|---|
| Columns, segmented radial, arc diagram, blast radius | hosts and what served them |
| Area grouping | a circle per host holding its profiles, the router, the pool and the cloud, sized by token volume |
| Router switchboard | entry points, profiles by host, role aliases in one router box, then devices and providers |
The View menu holds the layouts, "Collapse to one orchestrator", "Show each role", "Traffic" (moving dots, off when the system asks for reduced motion), "Issues only", and "Compare all fifteen", which shows every layout considered side by side and sets which one each role opens with.
| Key | Does |
|---|---|
| Space | play or pause |
| L | back to live |
| I | issues only |
| Arrow keys | previous or next change or issue start |
Flow
- Charts the window's requests from entry point to profile to model to what served them (a pool device, else the provider it was sent to), with requests per hour below. A failed call that nothing answered goes to "no answer (provider)" rather than counting against a provider: behind a router the provider is only a name like "custom".
- Each device or provider keeps the color it first got on this Desktop; red is reserved for failures. A client's failed calls count as requests and show as a red share of each bar (the router's own errors have no entry point and stay in the Errors card).
- Select any bar to isolate its traffic: a bar above the chart names it with its share, other bars count what passed through it, and the hourly chart scales to it with the failed share in red.
- What failed: when part of a selection failed, the side panel lists each error, where and
when, with links to the session in Trace and to the map. Under each, a cause line says how many
timed out at Hermes' 30 minute limit for a model call (
HERMES_API_TIMEOUT), how many other sessions had calls to that model in flight meanwhile, and what served those that got an answer. - Fit to screen (in the Request flow header) gives the chart the page's full width on a wider canvas, so its labels read larger without the bands swelling, and moves the side panel below it: what failed on the left, where the requests went on the right. "Side by side" puts it back; this Desktop remembers which.
- A link to something with no requests in the window says so and offers the last 7 days.
Activity
- Errors, gateway state changes, kanban events, host check changes, merged MRs and model loads, grouped by hour and filtered by kind. An entry opens to its raw lines; an error links to its model's traffic.
- Activity summaries (off by default) rewrite each entry as one plain sentence, written by the model set for the "Operations activity summaries" auxiliary task in Hermes' model settings. Each sentence names the model, its provider and how many events it read. Summaries are cached, and no model is called while the setting is off.
Handoffs
- One lane per agent: a dot on the sender's lane, the bar on the receiver's, hatched while open. Below it, a summary by kind and pair, and every handoff with its status.
- Covers kanban cards (who created, who was assigned, every run and outcome) and subagent delegations (grouped by parent session, with each subagent's model and request count).
- Move an open card forward, all through Hermes' own kanban functions:
- hand it to a profile, whose worker starts at once with the card's history, under the same kanban limits the gateway applies (the page says when it could not start, and why)
- schedule it for a set time; the gateway hook in
__init__.pyputs it back to ready on the first dispatcher tick after that time, so it starts within about two minutes - reply to a blocked worker and unblock it (the reply goes on the card as "dashboard")
- mark it done with a result, or close it as not needed
Trace
- Lists the window's sessions that made model calls. One opens as a timeline of its calls: turn, model, what served it, time to first token, tokens and any failure, plus the subagents it started (and for a subagent, its parent).
- Why it took this long splits the session into model calls and the waits between them (calls that overlap count once), names the longest wait, and lists calls that took at least twice as long as usual.
- Retries: Hermes retries a failed call under the same request id, timing each attempt from the first. Trace shows each as "attempt k of n", drawn from where the attempt before it ended, and says whether a later attempt got the answer.
- Failed calls: the call's side panel says what happened: whether it timed out, which attempt it was, how many other sessions were waiting on the same model, and what served those that were answered and in how long. "See its traffic" opens Flow on that model from an hour before the call to an hour after it.
- Explain this session asks the model set for the "operations_summary" auxiliary task to read the trace (the analysis and up to 60 calls, failed and slowest first) and say what happened in a few sentences. It runs once per click and stores nothing; check it against the calls.
- "Usual" is the median of similar calls in the week before: same model on the same server, half to twice the output tokens, from other sessions. With fewer than five, it says so.
Merge requests
- Open MRs and those merged in the window, with counts by repo.
- Who each is waiting on (a reviewer, or the author when the pipeline failed or there are conflicts) and for how long.
- The newest pipeline's stages: a retried job counts by its latest run, an allowed failure as passed. Each MR opens to its details with links to GitLab.
Conformance
Projects, with no setup
- Checks every project Hermes knows (Desktop's sidebar for the current profile, up to 30) against a built-in standard: no private keys, API tokens or merge conflict markers in tracked files, and no hard-coded home directories in code.
- Reads only git-tracked files, and rereads a folder only when git shows it changed, so a fix shows within a minute. A cell opens to the lines found and the fix.
- Hand a project to a profile: after a confirm step it files one kanban card naming each finding by file and line with its fix. The matched lines stay off the card, since for a key or token rule they are the secret. Asking again while the card is open returns the same card.
A project's own rules: add a conformance.yaml at the project root. Its absent rules (a
pattern that must not appear in the files a glob matches) apply to that project only:
repo_rules:
  - id: no-todo-markers
    title: No TODO markers in scripts
    severity: warns            # or blocks
    check: { kind: absent, pattern: 'TODO\b', paths: ["*.sh"] }
    exceptions:
      - { path: scripts/legacy.sh }
    fix: Finish it or file a card.
A rule whose id the built-in or fleet standard already defines keeps that definition, so a project cannot loosen it. A rule that does not parse is named on the project's row; the others still run.
A fleet standard (the Conformance project setting, or a local one)
- Its
absentrules join the built-in ones for every project, and the tab adds each host's checks and, for a GitLab repo, the standard's CI checks of that repo. - No GitLab needed: "Start a local standard" writes
~/.hermes/conformance/conformance.yaml, used whenever the setting is empty. - The side panel counts each check's failing projects and hosts, and names hosts that drifted or stopped reporting.
Fixing a host (the dashboard never reaches into other hosts itself)
- Hand it to a profile: files one kanban card with the failing checks, evidence, why they matter, the fix and any command, and that profile's worker starts on it.
- I'll run it: lists each failing check with its fix and, where the rule has a
remediatefield, the command to copy. - Either way the request shows in Activity, and the host's panel reports the result from its next report: waiting, fixed, or still failing.
Proposing a rule
- "Propose a rule" opens a merge request on the Conformance project, from the main it read, so a change merged since shows as a conflict instead of being undone. The repo's CI checks it and a person merges it; main is never written directly.
- A local standard has no repo to review it, so the rule is written into the file.
Business mode (sending rules to a Hermes organisation's shared copy of the standard) is switched off in this version, whatever the account or sync settings. Every install runs in single user mode.
Notifications and alerts
- While Desktop runs, Operations checks Needs attention every minute and alerts on each new item (a gateway that dropped, a health finding, a host that went quiet): a toast with a link, and a system notification while you are away (Settings > Notifications > "Plugin notifications").
- More than three at once arrive as one summary. Kanban cards are left to the Kanban plugin.
- A health finding that suggests checking a session for a retry loop is corrected when that session's calls timed out instead: the model was slow or queued, which Trace shows.
- What has been alerted is remembered across restarts. The first run only records what is already listed; an item that clears alerts again if it returns.
- The Notifications tab keeps the newest 200 alerts with an unread count, since Desktop has no notification center. The first time it is written, items already open are listed as "already open", without a toast.
- Alerts with Desktop closed: set Discord alerts (below) and restart the gateway. It checks on the kanban dispatcher tick, about once a minute, under the same rules. Set it in one profile only, or each profile posts its own copy.
Setup checklist
A fresh install shows a toast once with the number of steps left, a "Set up Operations" checklist on the Notifications tab, and an "N setup steps left" link on Overview. The steps:
- turn on
operationsunderplugins.enabledin each profile (then restart Desktop; a profile that lists it underplugins.disabledis left alone) - the metrics collector and the kanban board
- the Conformance project and what happens when a host drifts
- optionally, Discord alerts
Settings steps open the plugin settings. Desktop builds that form only for a profile with its own
copy of the plugin, so for a profile using ~/.hermes/plugins the step shows the
hermes -p <profile> config set ... command with a Copy command button.
Collapse folds the checklist to one line naming the steps still to do; this Desktop remembers it.
Roles
Viewing the page as a role (SRE, DevOps and so on) and editing roles is a business feature and is not available yet; everyone sees the Everyone view.
Settings
All optional, in Capabilities > Plugins > Operations (the gear), stored under
plugins.entries.operations.settings in the profile's config.yaml. From the command line:
hermes -p <profile> config set plugins.entries.operations.settings.<key> <value>.
| Setting | Key | Default | What it does |
|---|---|---|---|
| Conformance project | conformance_project |
empty | group/repo or a local conformance.yaml path; adds a fleet standard. Empty uses ~/.hermes/conformance/conformance.yaml if it exists |
| GitLab host | gitlab_host |
empty | your GitLab server, such as gitlab.com (or GITLAB_HOST) |
| GitLab token | gitlab_token |
empty | read_api to read; api to propose a rule (or GITLAB_TOKEN) |
| Model router token | model_router_token |
empty | bearer token for the router's status endpoint, if it asks for one (or MODEL_ROUTER_TOKEN) |
| Activity summaries | activity_summaries |
off | model-written Activity sentences |
| Discord alerts | alert_target |
empty | discord, discord:<channel>, or any hermes send target |
| When a host drifts | drift_action |
button |
button offers a fix card or "I'll run it"; automatic files and starts the card for drift_profile at most once a day per host; off shows the checks only |
| Profile for automatic fix cards | drift_profile |
empty | who works the automatic cards |
- Set once on default: a setting the default profile has applies to every profile that leaves it empty, and the checklist says "Set in the default profile". The gateway still reads each profile's own Discord alerts and automatic fix card settings, so those happen once.
- Host results come from the
conformance_resultstable inmetrics.db, written by the metrics forwarder on each host once itsCONFORMANCE_STANDARDpoints at a copy of the standard (hermes-metrics-dashhost_checks.py). A GitLab standard's CI jobstandardmust publishconformance-report.json. A host silent for 25 minutes shows as stale, and a result whose ingest token could not vouch for the host is marked unverified.
Data
Reads (all read-only)
| Source | For |
|---|---|
<hermes root>/metrics/metrics.db (hermes-metrics-dash) |
requests, errors, hosts, conformance results |
| the kanban board | cards, runs and handoffs |
| GitLab | merge requests, pipelines, the fleet standard |
<hermes root>/plugin-data/gitlab-mr/device-aliases.json |
pairing hosts with pool devices |
profile config.yaml files |
where the plugin is enabled, and which profiles can change router roles (rolectl-mcp with writes on) |
| the model router's status endpoint | router roles: which models are loaded and with how much context |
LM Studio's local server (LMSTUDIO_URL, default http://127.0.0.1:1234) |
which of a role's candidates it could load |
Shell commands are only git status, git rev-parse and git ls-files in checked project folders
(conformance); nothing else runs.
A missing source shows as "unavailable" or "not set up" in its own section. If the metrics database or kanban board does not exist yet, the page still loads, a note says which is missing, and nothing is created.
Writes, only through these actions:
- kanban cards (Handoffs and Conformance fix cards, through Hermes' own kanban functions)
- merge requests proposing a rule (never main)
- its own files under
<hermes root>/plugin-data/operations/:roles.json,summaries.json,fixes.json
Package plugins/operations/:
| Path | What it is |
|---|---|
plugin.yaml |
manifest and the settings form |
__init__.py |
the gateway hook: starts scheduled cards, Discord alerts, automatic fix cards |
dashboard/ |
backend routes at /api/plugins/operations/ (the web dashboard tab is hidden) |
desktop/plugin.js |
the page; Desktop copies it into desktop-plugins/operations/ |
Test
~/.hermes/hermes-agent/.venv/bin/python3 -m unittest discover -s tests
Later ideas
- Shared plugins in Hermes itself. Operations is installed once, in
~/.hermes/plugins, but every profile has to list it underplugins.enabledbefore Desktop shows it, andhermes -p <profile> plugins enable operationsfails for named profiles because it only looks in that profile's own plugins folder. A change in hermes-agent could fix both: treat a plugin installed in the root folder as available to every profile (still honouring each profile'splugins.disabled), or let the enable command find root-installed plugins. That would let the setup checklist drop its "turn on in every profile" step. It needs an upstream change, and hermes-agent keeps profiles separate on purpose, so it may not be accepted. Managed scope (/etc/hermes/config.yaml) is not a substitute: it replaces each profile's wholeplugins.enabledlist rather than adding to it.