 olric3015
stream-speed
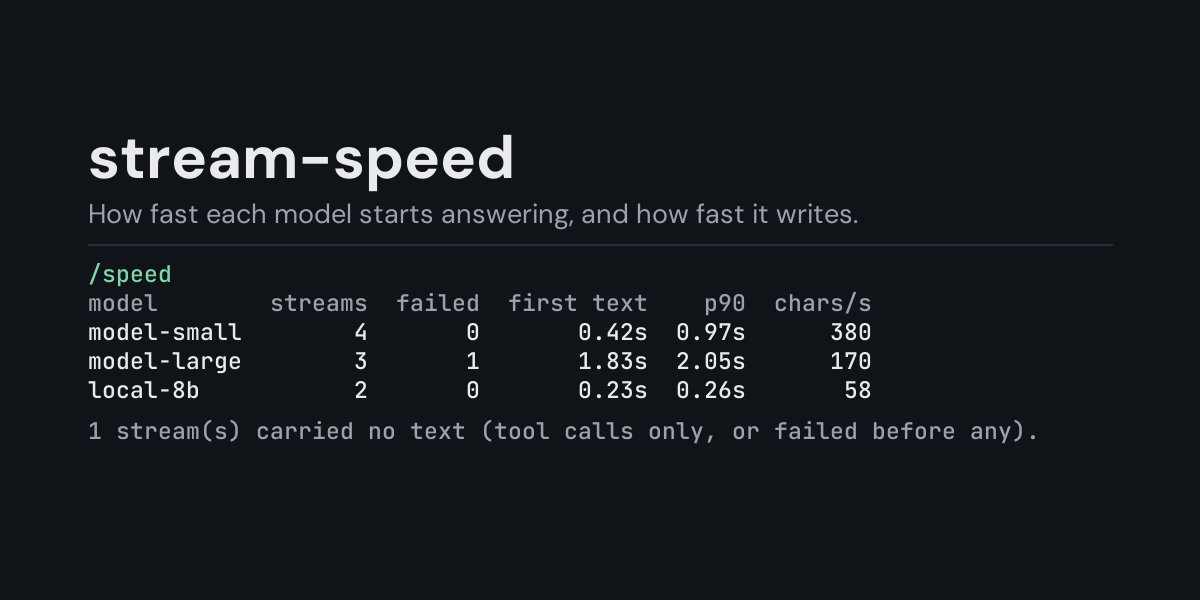
Records how fast each model starts answering and how fast it writes, and shows it with /speed.
Hermes fires three observer hooks around every streamed model response: on_stream_start,
on_stream_delta and on_stream_end. stream-speed pairs them into one row per response:
the time until the first visible text, the total time, and how many characters arrived. /speed
turns those rows into medians per model, so you can see which model or provider keeps you
waiting before the first word and which one writes slowly once it starts.
Install
hermes plugins install stream-speed --enable
Requires Hermes 0.21.5 or newer. No API key, no configuration, no dependencies.
Use
/speed             last 24 hours, by model
/speed session     the most recent session that streamed a response
/speed all         everything recorded
/speed 7d          the last 7 days (any number of hours or days: 6h, 30d)
/speed providers   add to any of the above to group by provider instead of model
/speed days        add to any of the above to group by day, newest first
/speed recent      add to any of the above to list the newest 10 streams instead
/speed recent 25   the newest 25 instead (1 to 100)
/speed clear       delete the record
/speed session is the quick check after a conversation that felt slow. /speed providers
compares providers that serve you the same model, and a time window (/speed 6h, /speed 7d)
shows whether a slowdown is new. The record keeps its newest 5,000 streams, so a long window on
a busy install reaches back only as far as those rows do.
Example (/speed all, from the end-to-end test: two one-shot turns against a loopback provider
that sends 16 characters every 0.15 s):
Streaming speed, all recorded:

model       streams  failed  first text    p90  chars/s
fake-model        2       0       0.92s  1.00s      111
- first text is the median time from the start of the streaming request to the first
visible text; p90 is the slow end of the same number. - chars/s is the median writing speed between the first text and the end of the stream.
It counts characters, not tokens: the streaming hooks carry no token counts. - failed counts streams that errored or did not finish.
- Streams with no visible text (a response that is only tool calls) are counted, shown with no
first-text time, and mentioned in a footer line.
/speed days puts one day on each line, newest day first, so you can see the day a provider
became slow. Days are your computer's local calendar days, and a day with no streams has no
line. Example (the plugin's own output for a sample week):
Streaming speed, last 7 days:

day         streams  failed  first text    p90  chars/s
2026-10-06        4       1       4.20s  5.10s       79
2026-10-05        2       0       1.15s  1.30s      127
2026-10-04        3       0       0.90s  1.10s      139

1 stream(s) carried no text (tool calls only, or failed before any).
/speed recent lists the newest 10 streams of the window one by one (/speed recent 25 lists
25, up to 100), newest first, so the one
slow answer behind a median can be found. total is the whole stream, and result is ok,
failed (the stream errored) or unfinished (it ended without finishing). Example (the
plugin's own output for sample rows):
Streaming speed, last 7 days, newest 5 of 5:

when       model    provider  first text   total  chars/s      result
1m ago   m-small      custom       1.12s   4.95s      452          ok
40m ago  m-large  openrouter       0.74s   7.88s      370          ok
42m ago  m-large  openrouter           -  30.00s        -  unfinished
3h ago   m-small      custom       1.37s   6.02s      406          ok
2d ago   m-large  openrouter       0.82s   9.41s      363          ok
How accurate it is
Hermes delivers stream hooks off the token path, on a queue with its own worker thread per
hook, so each timestamp is taken when the event is delivered, a few milliseconds after the wire.
first text starts when Hermes begins the streaming request, so it includes connection setup
as well as the provider's own delay; that is the wait you actually sit through. In the test
above the provider's 107 chars/s is measured as 110-111. Reasoning deltas are ignored: first
text means text you can read.
If the first-delta event is still queued when the end event arrives, the plugin waits up to
0.25 s for it; a stream whose order still cannot be established is recorded with an unknown
first-text time and is never reported as zero.
What is recorded
One JSON line per streamed response in <HERMES_HOME>/plugin-data/stream-speed/streams.jsonl
(per profile):
ts, session_id, iteration, provider, model, surface, ttft_s, duration_s,
chars, finished, failed.
Not recorded: the streamed text, reasoning text, prompts, error messages (only a failed flag).
The file is bounded: once it passes 2 MB it is rewritten to its newest 5,000 rows.
Security and footprint
register()only registers three hooks and one command (/speed), plus anatexithandler
that waits at most one second for a stream still open at exit (so a one-shot run records its
last answer).- No network access, no subprocesses, no downloads, no credentials read.
- Writes only
streams.jsonlunder its own plugin data directory./speed cleardeletes it. - The streamed text passes through the hook payloads in memory; only its length is kept.
- Hooks are observer-only and never raise: an unwritable record is logged at debug level.
- In memory it tracks at most 256 open streams and drops any older than an hour.
- Standard library only.
Development
python -m pytest tests
PYTHONPATH=<hermes checkout> python tests/e2e/stream_speed_e2e.py
hermes plugins validate stream-speed
Changes
- 1.4.0:
/speed recenttakes a row count,/speed recent 25(1 to 100; ten without
one). What is recorded did not change. - 1.3.0:
/speed recent, the newest 10 streams of any window, newest first, with their
model, provider, time to first text, total time, writing speed and result. What is recorded
did not change. - 1.2.0:
/speed days, one line per day with streams, newest day first; works with every
window (/speed 30d days). The record also reads correctly after a Windows tool has saved it
with a byte-order mark. What is recorded did not change. - 1.1.0:
/speed session, time windows (/speed 6h,/speed 7d, any number of hours or
days) and grouping by provider (/speed providers). What is recorded did not change. - 1.0.0: first release.
MIT licensed.
README from the reviewed commit d7b48bb; it updates when the author re-pins.